Asia small cap equities: Unleashing the strength of hidden gems
From Small to Large: Why early exposure matters
Over the past five years, Asia small caps have outperformed Asia large caps by an annualised return of 2.83 per cent at the index level (Fig. 1). This outperformance has been led largely by smaller, high-growth companies in Taiwan, India and Korea. Notably, small caps also recorded lower volatility than large caps over the same period – countering the widely held view that smaller companies typically have higher market fluctuations (Fig. 1).
A core reason to consider small caps is that they are often in the most accelerated phase of a company’s growth—before the opportunity is fully recognised by the market and the stock transitions into large cap indices.
To demonstrate this effect, we analysed Asia-listed small cap companies that were later added to the Asia standard large cap index, comparing returns of over 150 companies in the 12 months before and 12 months after index inclusion. The study was conducted for the time period from May 2020 through February 2026. The results were clear: on average, these stocks delivered 245 per cent return in the year prior to inclusion, versus 18 per cent in the year following inclusion. The takeaway is that a meaningful share of value creation can occur ahead of index inclusion, reinforcing the case for selective, research-led exposure to small caps as a source of differentiated return potential.
Fig. 1: Asia small caps outshine large caps over the last five years
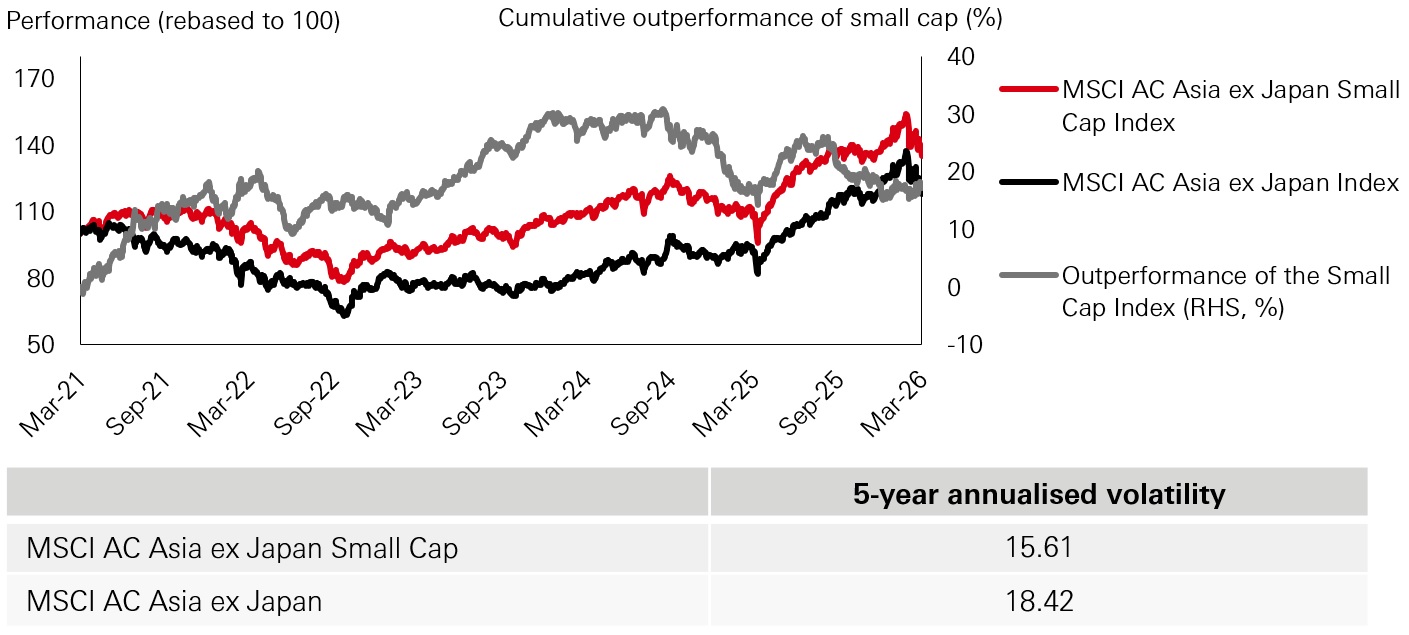
Source: MSCI, Bloomberg as of March 2026.
Discovering unique alpha opportunities in Asia small caps
AI infrastructure, defence spending, robotics and energy transition are core investment themes within our Asia small cap strategy. While these themes are widely recognised, our differentiation lies in how we gain exposure. Rather than concentrating in crowded, headline beneficiaries – where valuations can quickly assume best-case outcomes – we focus on under-owned “picks-and-shovels” businesses positioned one or two steps back in the value chain. These companies can benefit from the same structural tailwinds, often with stronger valuation support and more diversified end-demand.
Case study 1: Power transmission capex: Value chain access at a discount
A clear example is our positioning in the power transmission capex upcycle (Fig. 2). Instead of paying premium multiples for transformer manufacturers that have become the market’s consensus trade, we hold an Indian copper wire producer that supplies original equipment manufacturers (OEM). As grid investment accelerates – supported by renewable integration, electrification and rising data-centre power demand – copper-intensive components are seeing direct pull-through demand. Crucially, this provides exposure to the same multi-year build-out at around a quarter of the valuation of the better-known transformer names, offering a more efficient route to participate in the cycle.
Fig. 2: India companies’ rising spending in power generation and transmission
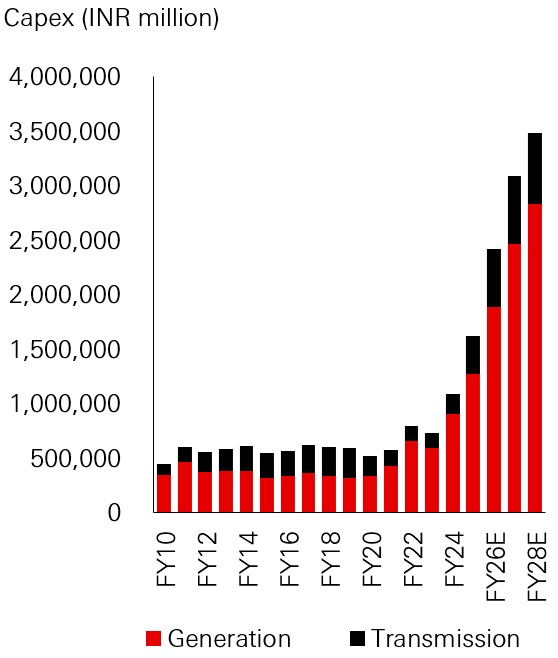
Source: Spark‘s estimates, data as of April 2026.
Case study 2: Satellite networks – Finding alpha in the enabling supply chain
Our Asia small cap investment strategy sees an opportunity in a Taiwan manufacturer specialising in high-quality radio-frequency waveguides and components essential for satellites and ground infrastructure. This innovative company supplies advanced products to leading satellite operators globally, including a major US-based low-earth-orbit (LEO) network provider. By focusing on this specialised Asian supplier rather than the satellite operators themselves, we gain strategic exposure to the rapidly growing LEO satellite industry at a more attractive valuation – around one-fifth of the multiple implied by the US based operator’s anticipated IPO.
With mega-constellation satellite networks transforming connectivity, this Taiwan company is well placed to capture the upside, with satellite launches projected to grow from 1,722 in 2022 to 13,000 by 2028 (Fig. 3). At the same time, the Taiwan company is set to gain from increasing satellite complexity, as operators seek to boost data throughput. This shift towards multi-band payloads is expected to drive demand for satellite components and increase prices significantly.
As global needs for defence, communications, surveillance, and secure connectivity grow, the demand for enabling technologies like waveguides is increasing. Investing in supporting technologies allows us to tap into growth opportunities while potentially avoiding risks like operational challenges, high capital requirements, and funding uncertainties that may come with satellite operators.
Fig. 3: Asia small cap company provides supporting technologies for increasing satellite launches
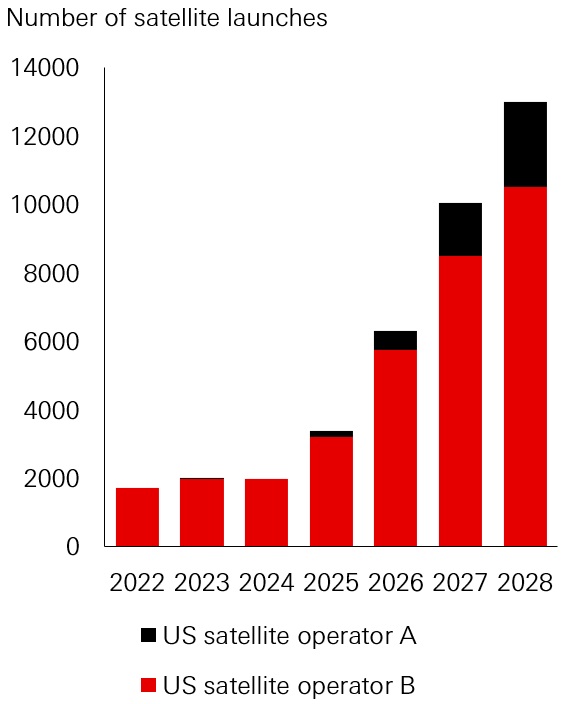
Source: Goldman Sachs estimates, data as of April 2026.
Think bigger with India’s small caps
The rapid growth of India’s e-commerce landscape
While India has underperformed some other emerging markets over the past year, we remain constructive on its medium- to long-term structural growth outlook. Key tailwinds include favourable demographics – which are supporting consumption upgrades – and infrastructure development – which is central to the country’s growth agenda. As a meaningful market in the Asia small cap universe, India is seeing domestic companies scale up to meet the needs of a rapidly expanding economy.
Within our Asia small cap strategy, we view India as a rich source of under-researched opportunities with attractive long-term earnings potential. One area of interest is in the e-commerce and express-parcels market, where penetration in India remains structurally below that of other more mature regions, creating a long runway for organised third-party logistics providers as the industry consolidates. In FY2025, at 3-4 shipments per capita, India is still far behind its global counterparts, such as China and the US, where the level is 60-80 shipments per capita, implying significant headroom for growth (Fig. 4).
The quick commerce segment in India is projected to witness robust growth, with shipments expected to increase at a 23-27 per cent compounded annual growth rate (CAGR) between FY2025 and FY2030, reaching 15-16 billion deliveries, according to a Redseer report (Fig. 4). The report also highlights that companies offering both foundational and surge delivery capabilities are likely to emerge as key differentiators in the hyperlocal space. We believe that companies with a scalable presence in e-commerce, combined with strong delivery infrastructure, can capitalize on this structural growth opportunity.
All in all, our holding in this segment is executing well in an increasingly supportive market structure, gaining share through strong operational delivery while maintaining lower capital intensity than many peers. Supported by healthy cash-flow conversion and sustained growth prospects, the e-commerce area is poised to benefit as outsourcing trends and scale advantages continue to strengthen across India’s logistics ecosystem.
Fig. 4: India’s e-commerce shipments volumes have substantial room to grow
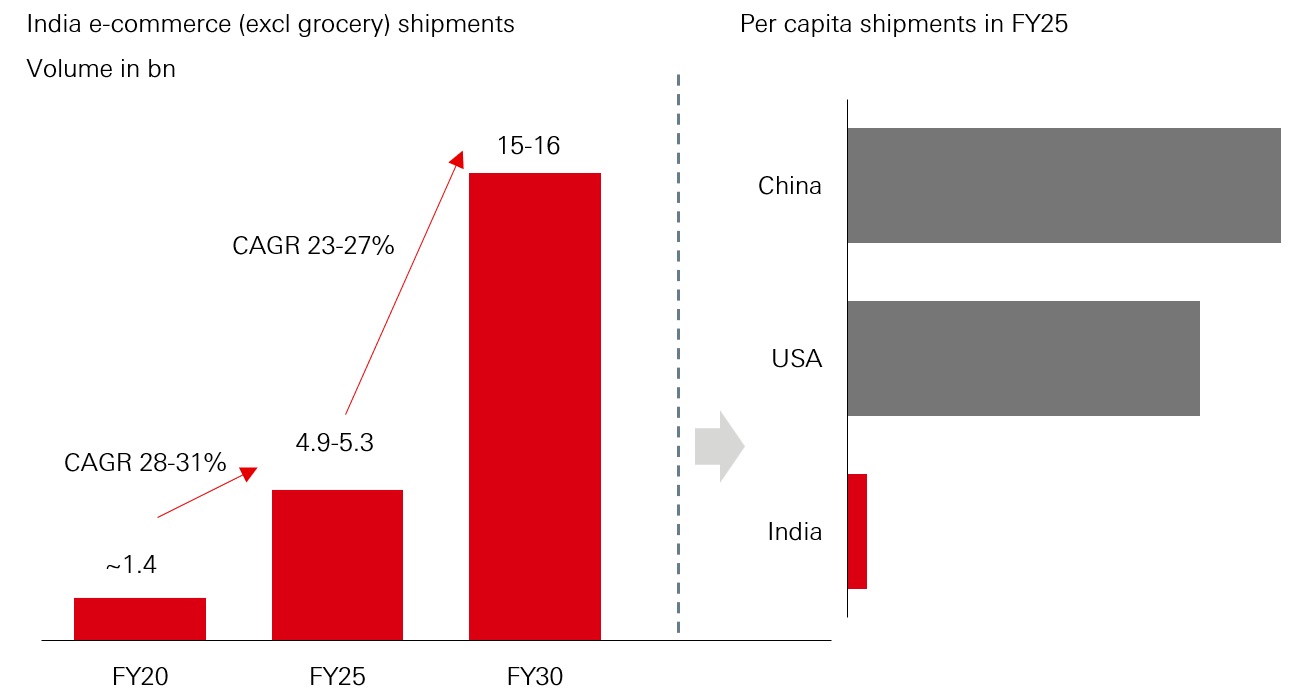
Source: Redseer Report, Morgan Stanley, March 2026.
Note: E-commerce shipments includes the total volume of shipments including Delivered plus Return to Origin (RTO) (single parcel count for forward and return legs of RTO) plus Reverse Pick-Up shipments across eCommerce, D2C, Formalized social commerce, omnichannel by traditional brands.
Unlocking growth in Asia’s small cap universe
From a geographic perspective, Taiwan constitutes the largest portion of the Asia ex Japan Small Cap index at 25 per cent, followed closely by India and Korea, which account for 23 per cent and 19 per cent respectively. Collectively, these three markets represent 67 per cent of the index, while Hong Kong and Mainland China contribute approximately 17 per cent, with the remainder spread across ASEAN countries (Fig. 5). The geographic composition contrasts sharply with that of Asia large caps, where Hong Kong and Mainland China comprise one-third of the representative index.
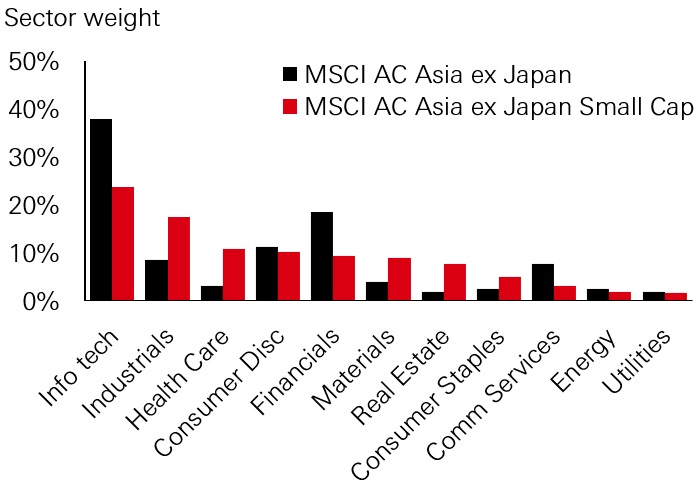
This broader geographic exposure can be seen at the sector level as well. New economy sectors such as information technology, industrials, healthcare, and consumer discretionary make up 62 per cent of the Asia ex Japan Small Cap index, compared to the large-cap index, which is heavily weighted towards state-owned enterprises in traditional sectors such as financials. The wider country and sector exposure within Asia’s small cap index helps to mitigate country- or sector-specific volatility, potentially providing investors with a more balanced and diversified range of investment opportunities (Fig. 6).
Fig. 5: In Asia’s small cap index, Taiwan, India and Korea represent 60 per cent of the index
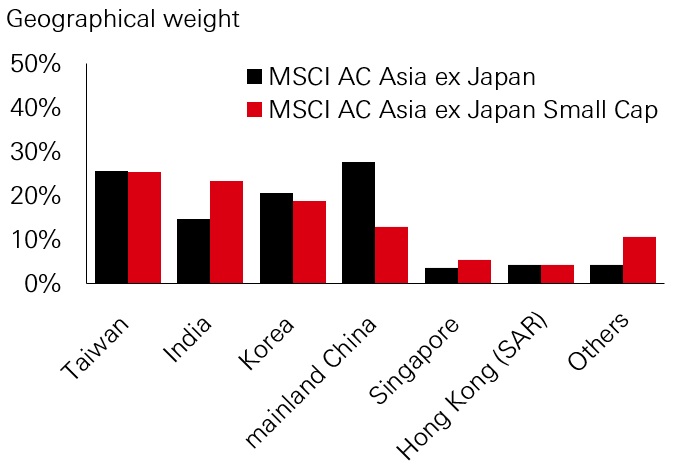
Fig. 6: The small cap index is more diversified with growth-focused companies often overlooked
Source: MSCI, data as of February 2026.
Diversification and long-term alpha generation potential in HSBC Asia small caps
With investors increasingly diversifying beyond the US, Asia ex Japan small caps offers a differentiated way to access the region’s next generation of potential winners. Given limited coverage and index representation, active, research-led stock selection is essential to identify high-quality businesses early. HSBC’s Asia ex Japan small cap strategy aims to provide targeted exposure to structural growth themes at disciplined valuations, aligned with a Growth at a Reasonable Price (GARP) approach, for investors seeking long-term alpha and meaningful diversification.
This commentary has been produced by HSBC Asset Management to provide a high level overview of the recent economic and financial market environment, and is for information purposes only. The views expressed were held at the time of preparation; are subject to change without notice and may not reflect the views expressed in other HSBC Group communications or strategies. This marketing communication does not constitute investment advice or a recommendation to any reader of this content to buy or sell investments nor should it be regarded as investment research. The content has not been prepared in accordance with legal requirements designed to promote the independence of investment research and is not subject to any prohibition on dealing ahead of its dissemination. You should be aware that the value of any investment can go down as well as up and investors may not get back the amount originally invested. Furthermore, any investments in emerging markets are by their nature higher risk and potentially more volatile than those inherent in established markets. Any performance information shown refers to the past and should not be seen as an indication of future returns. You should always consider seeking professional advice when thinking about undertaking any form of investment.
Source: HSBC Asset Management, as of April 2026.
Past performance does not predict future returns. Any forecast, projection or target contained in this presentation is for information purposes only and is not guaranteed in any way. HSBC Asset Management accepts no liability for any failure to meet such forecasts, projections or targets. The views expressed above were held at the time of preparation and are subject to change without notice. The information provided does not constitute any investment recommendation or advice. Diversification does not ensure a profit or protect against loss. For illustrative purposes only.
Important information
The value of investments and the income from them can go down as well as up and investors may not get back the amount originally invested. Past performance contained in this document is not a reliable indicator of future performance whilst any forecasts, projections and simulations contained herein should not be relied upon as an indication of future results. Where overseas investments are held the rate of currency exchange may cause the value of such investments to go down as well as up. Investments in emerging markets are by their nature higher risk and potentially more volatile than those inherent in some established markets. Economies in Emerging Markets generally are heavily dependent upon international trade and, accordingly, have been and may continue to be affected adversely by trade barriers, exchange controls, managed adjustments in relative currency values and other protectionist measures imposed or negotiated by the countries with which they trade. These economies also have been and may continue to be affected adversely by economic conditions in the countries in which they trade. Mutual fund investments are subject to market risks, read all scheme related documents carefully.
This commentary has been produced by HSBC Asset Management to provide a high level overview of the recent economic and financial market environment, and is for information purposes only. The views expressed were held at the time of preparation; are subject to change without notice and may not reflect the views expressed in other HSBC Group communications or strategies. This marketing communication does not constitute investment advice or a recommendation to any reader of this content to buy or sell investments nor should it be regarded as investment research. The content has not been prepared in accordance with legal requirements designed to promote the independence of investment research and is not subject to any prohibition on dealing ahead of its dissemination. You should be aware that the value of any investment can go down as well as up and investors may not get back the amount originally invested. Furthermore, any investments in emerging markets are by their nature higher risk and potentially more volatile than those inherent in established markets. Any performance information shown refers to the past and should not be seen as an indication of future returns. You should always consider seeking professional advice when thinking about undertaking any form of investment.
The views expressed above were held at the time of preparation and are subject to change without notice.
There is no guarantee that these investment strategies will work under all market conditions or are suitable for all investors and each investor should evaluate their ability to invest for a long-term especially during periods of downturn in the market. No representation is being made that any account, product, or strategy will or is likely to achieve profits, losses, or results similar to those shown.
This document is prepared for general information purposes only and does not have any regard to the specific investment objectives, financial situation and the particular needs of any specific person who may receive it. Any views and opinions expressed are subject to change without notice. This document does not constitute an offering document and should not be construed as a recommendation, an offer to sell or the solicitation of an offer to purchase or subscribe to any investment. Any forecast, projection or target where provided is indicative only and is not guaranteed in any way. HSBC Global Asset Management (Hong Kong) Limited (“AMHK”) accepts no liability for any failure to meet such forecast, projection or target. AMHK has based this document on information obtained from sources it reasonably believes to be reliable. However, AMHK does not warrant, guarantee or represent, expressly or by implication, the accuracy, validity or completeness of such information. Investment involves risk. Past performance is not indicative of future performance. Please refer to the offering document for further details including the risk factors. This document has not been reviewed by the Securities and Futures Commission. Copyright © HSBC Global Asset Management (Hong Kong) Limited 2026. All rights reserved. This document is issued by HSBC Global Asset Management (Hong Kong) Limited.
Content ID: D070555_V1.0 ; Expiry date: 30.04.2027