Rethinking Asia’s diversification role
Long treated as a regional allocation defined primarily by its sensitivity to global growth cycles, Asian markets are increasingly being shaped by local forces powerful enough to alter how diversification works across the region.
For many global allocators, Asia historically functioned as a higher-beta extension of external demand, where equities amplified global growth, local-currency bonds provided carry with volatility, and currencies acted as conduits through which global shocks were transmitted. This framework worked during periods of synchronised expansion but proved fragile during stress when correlations across Asian assets tended to rise sharply and diversification benefits faded just when they were needed most.
In recent years, this pattern has begun to change. Post-pandemic policy divergence, differentiated inflation dynamics, and China’s structural slowdown have weakened the forces that once synchronised Asian assets. The result is a more heterogeneous investment landscape in which correlations across equities, bonds and currencies are increasingly driven by domestic policy choices rather than by a single global or regional engine. This transition transforms Asia’s internal dispersion from a challenge into a potential source of portfolio resilience, provided investors understand how returns and risks propagate through the region.
Empirical analysis of diversification benefits in Asia
A critical starting point is recognising that correlation is not a fixed characteristic. It evolves with policy regimes, growth structures and capital flows. Over the past decade, correlations across Asian assets were largely governed by a small set of common anchors:
- US monetary policy
- China’s investment cycle
- Global trade volumes
- Commodity pricing
These forces created a tendency for Asian markets to move together, especially during episodes of US tightening or Chinese-led stimulus.
Recent experience highlights how fragile those assumptions can be. Rolling correlation analysis shows that Asia exhibits more time-varying and asymmetric correlations, undermining the usefulness of long-term averages as a guide to diversification. For example, Asian equities excluding Japan historically displayed a negative correlation of around -0.39 against the US dollar, reflecting the dollar’s defensive role.
Figure 1: Cross-asset correlations based on 20-year weekly returns
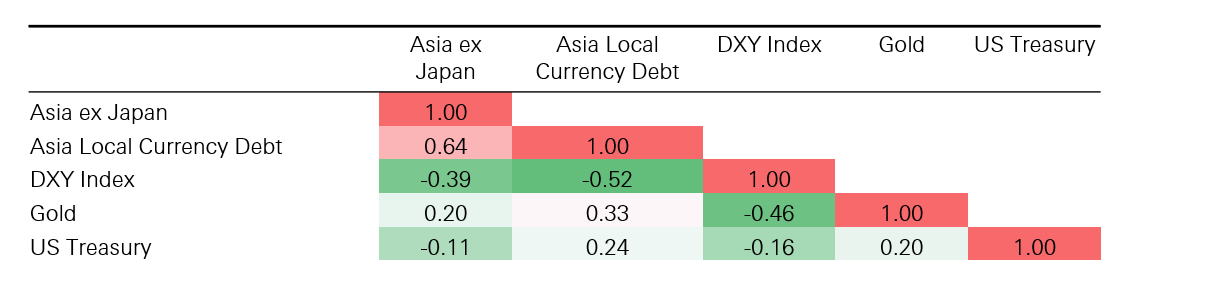
Click the image to enlarge
Source: HSBC AM, Bloomberg. Data as of November 2025.
However, following recent US policy shocks and renewed de-dollarisation dynamics, this relationship temporarily flipped positive as domestic policy responses within Asia overpowered traditional global linkages.
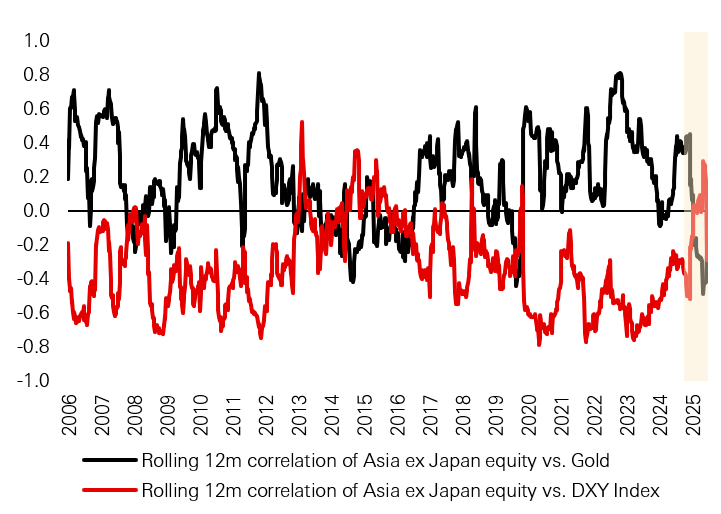
Click the image to enlarge
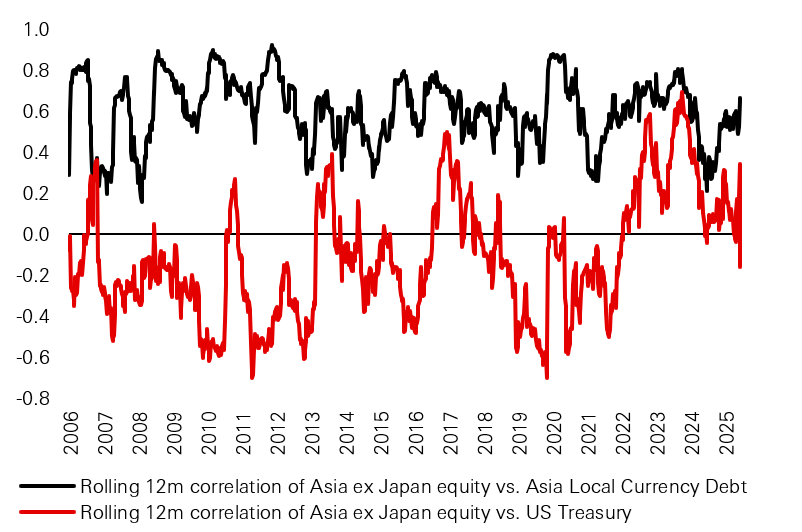
Click the image to enlarge
Past performance does not predict future returns.
Source: HSBC AM, Bloomberg. Data as of November 2025.
More importantly, these shifts are not uniform. Dynamic conditional correlation analysis1 indicates that correlation clusters are becoming increasingly asset- and country-specific rather than region-wide. India and China A-shares display one of the lowest bilateral equity correlations in Asia, at roughly 22 per cent, reflecting fundamentally different growth drivers and investor bases. At the other extreme, Korea and Taiwan show persistently high correlation of around 72 per cent, driven by shared exposure to global technology and semiconductor cycles, increasingly reinforced by the AI supply chain. This structural alignment has important implications. While both markets can deliver strong performance during upswings in the technology cycle, their diversification benefits relative to one another are inherently limited.
1 - Dynamic Conditional Correlation – A simple class of multivariate GARCH models, Robert Engle, 1999, Forthcoming Journal of Business and Economic Statistics 2002
Similarly, Indonesia and Malaysia, more commodity-linked than ever, saw bond resilience due to central bank interventions that prevented global risk sentiment from destabilising yields. These observations imply that correlations are fragmenting, not disappearing, raising the cost of simplistic regional allocations but opening the door to more deliberate, design-driven diversification.
Understanding diversification in Asia also requires examining interdependence and volatility spillovers rather than static correlations alone. To analyse this, a vector autoregression (VAR) framework was applied to daily returns, modelling current market performance as a function of its own lagged returns and those of other regional markets.
Figure 3: The coefficients Φ that are statistically significant at 5% (p-value < 5%)
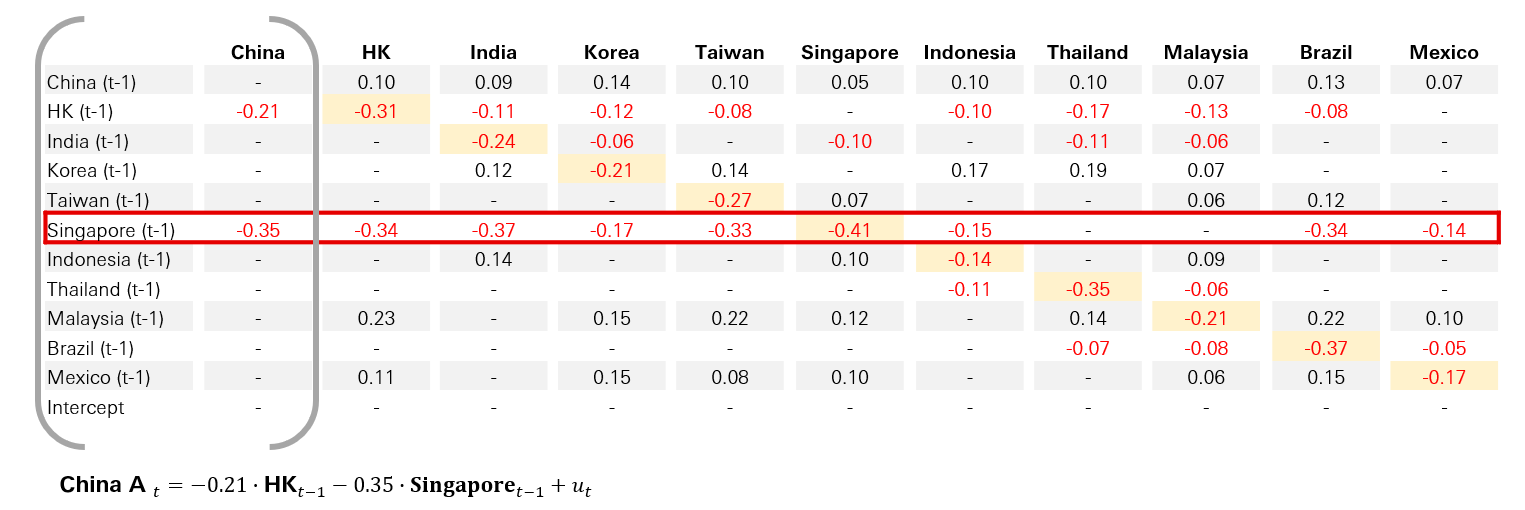
Click the image to enlarge
Source: HSBC AM. Data as of November 2025.
Broadly, most Asian equity markets exhibit negative relationships with their own one-period lagged returns, reflecting short-term mean reversion. China remains the dominant directional influence. Movements in China A-shares continue to shape returns across other Asian equity markets, confirming its role as a regional sentiment anchor even as economic spillovers weaken.
Additionally, volatility transmission analysis using multivariate volatility models2 shows that China remains the primary transmitter of volatility across Asia.
Figure 4: The volatility spillover from one market to another market - volatility decomposition
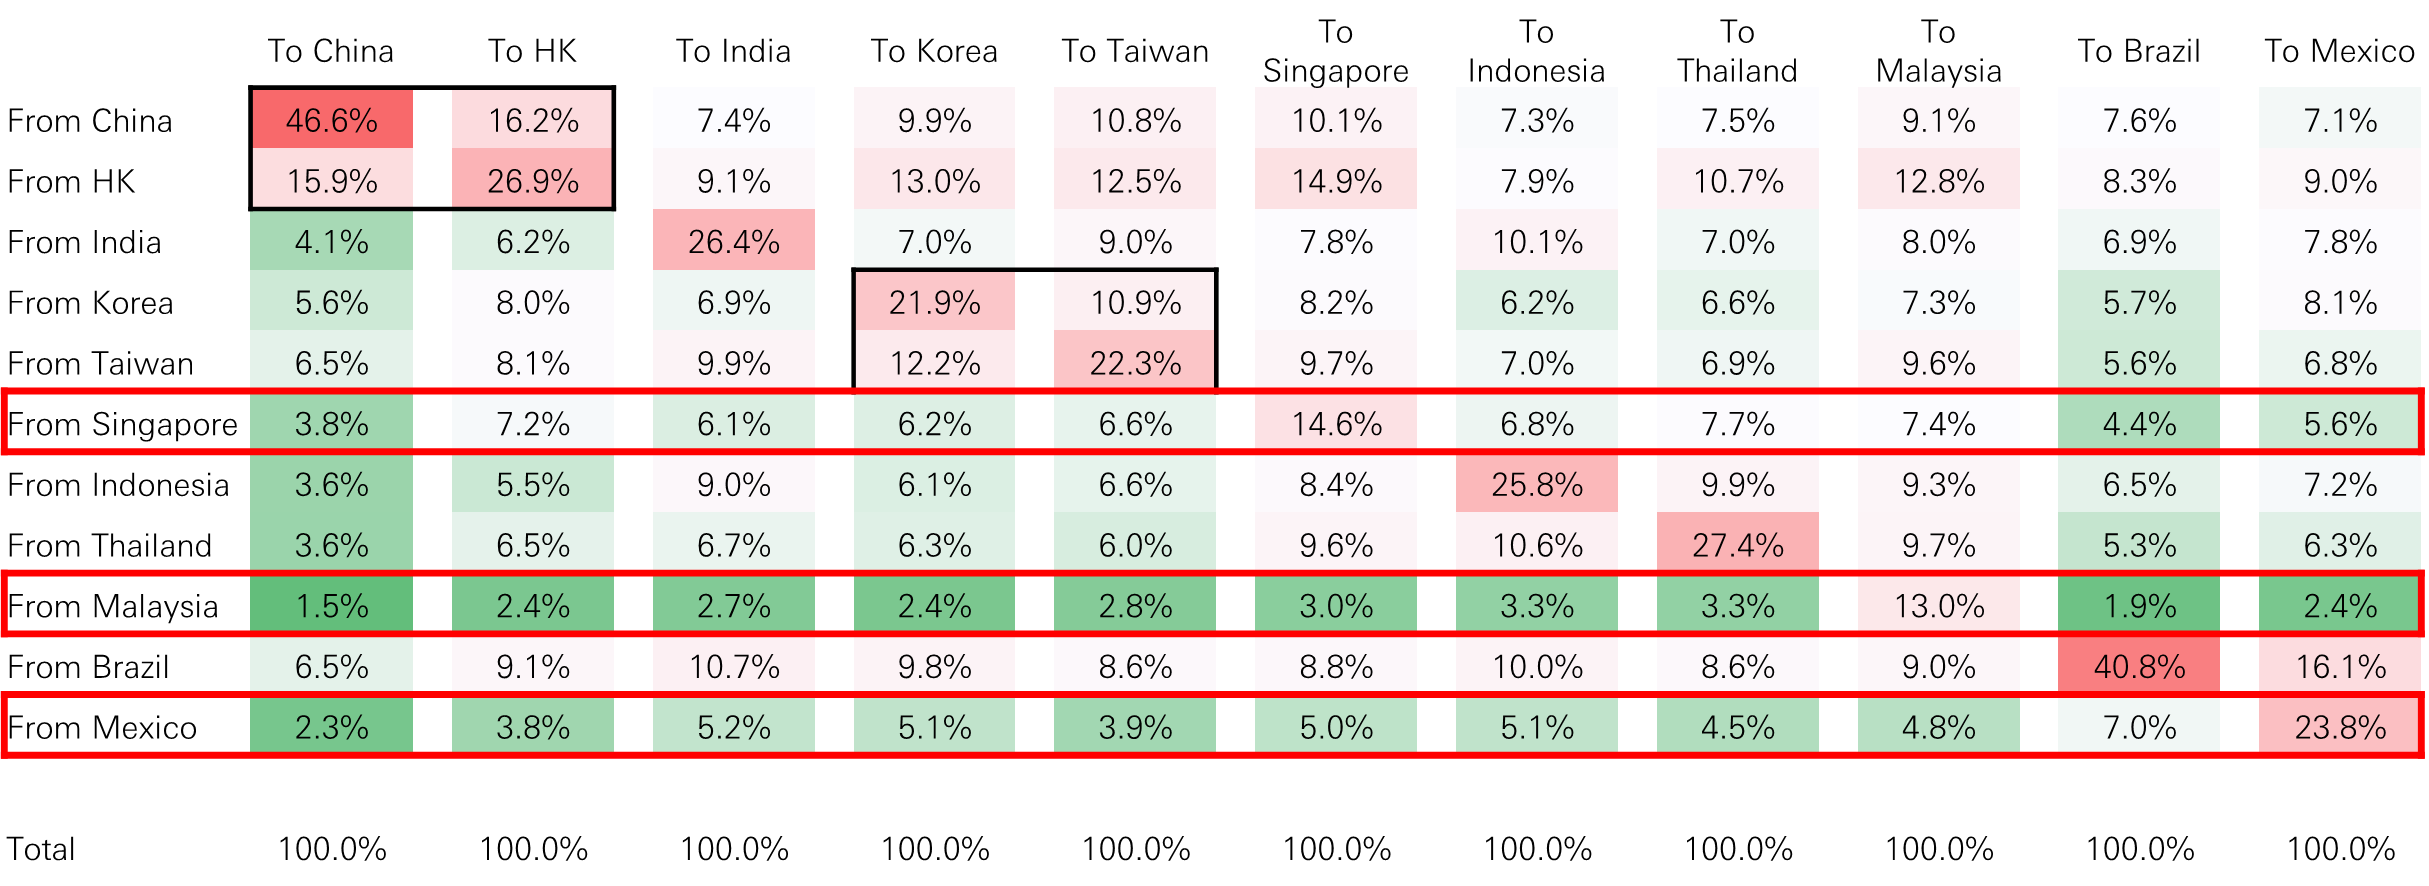
Click the image to enlarge
Source: HSBC AM. Data as of November 2025.
2 - Structure and Asymptotic Theory for Multivariate Asymmetric Conditional Volatility McAleer et al. (2009)
By contrast, Singapore and Malaysia tend to act as volatility absorbers rather than sources, reflecting strong institutional frameworks and domestically anchored drivers. Korea and Taiwan exhibit high mutual volatility spillovers, underscoring how deeply embedded both markets are within the same global technology cycle.
These findings imply that while return correlations have weakened, volatility transmission remains uneven and state-dependent. Effective diversification therefore requires monitoring not just where returns diverge, but where risks still cluster.
Fundamental analysis of diversification drivers
Policy divergence has emerged as the dominant driver of Asia’s internal differentiation. Central banks across the region now operate under increasingly distinct frameworks, reflecting differences in inflation sensitivity, growth objectives and institutional constraints. India has prioritised positive real interest rates to anchor growth and inflation credibility, while other economies rely on targeted easing or administrative measures to manage inflation pass-through.
Fiscal strategies further reinforce dispersion. Japan sustains aggressive fiscal support alongside accommodative financial conditions. India prioritises public capital expenditure. Indonesia deploys fiscal buffers to stabilise inflation, while China increasingly relies on quasi-fiscal credit channels. These divergent approaches weaken synchronisation in sovereign bond behaviour and alter bond-equity interactions across markets.
Regulatory divergence and geopolitics amplify these effects. Technology regulation in China, industrial policy in India, semiconductor export controls affecting Taiwan and Korea, and shifting defence alignments across ASEAN all influence capital flows and risk premia in ways not captured by traditional growth narratives alone.
China’s role illustrates this transformation most clearly. Once the primary synchroniser of Asian returns, China is now a source of differentiation. Its domestic liquidity cycle, regulatory environment and policy objectives increasingly decouple its market behaviour from export-driven peers. When sized appropriately, China exposure can now enhance diversification rather than concentrate risk.
Japan represents another structural inflection point. Its transition from entrenched deflation toward sustained inflation and wage growth has altered long-standing relationships between equities, bonds and the yen. Historical assumptions about Japan’s stabilising role can no longer be taken for granted.
Currency dynamics complete the picture. While the US dollar and Japanese yen retain counter-cyclical properties, several Asian currencies increasingly reflect domestic policy credibility and intervention capacity. The Indian rupee often stabilises during risk-off periods due to real-yield support and reserve policy. The Indonesian rupiah benefits from commodity-linked flows and active intervention. The Singapore dollar reflects a managed exchange-rate framework anchoring inflation expectations independently of interest-rate cycles.
Together, these factors indicate that Asia’s diversification is increasingly policy-led rather than growth-led, representing a structural shift rather than a cyclical one.
Implications for portfolio construction
The practical value of this analysis lies in portfolio construction. China A-shares serve as a useful reference point for evaluating hedges within an Asian multi-asset framework. Indian equities, Chinese government bonds and the US dollar exhibit relatively low average correlations with China A-shares, though with significant time variation.
An examination of historical drawdowns shows that Chinese government bonds and the US dollar consistently delivered positive performance during periods of equity stress, reinforcing their role as effective hedges. Indian equities, while often declining less than China A-shares, displayed more regime-dependent behaviour.
To formalise these relationships, hedge ratios following Kroner and Sultan (1993) were estimated. Lower ratios imply stronger hedging potential and lower cost. For example, a US$1 long position in China A-shares would historically require a short position of approximately US$0.78 in Indian equities to achieve hedge efficiency.
Figure 5: The average hedge ratio: How much to short one asset to hedge $1 long position in another asset
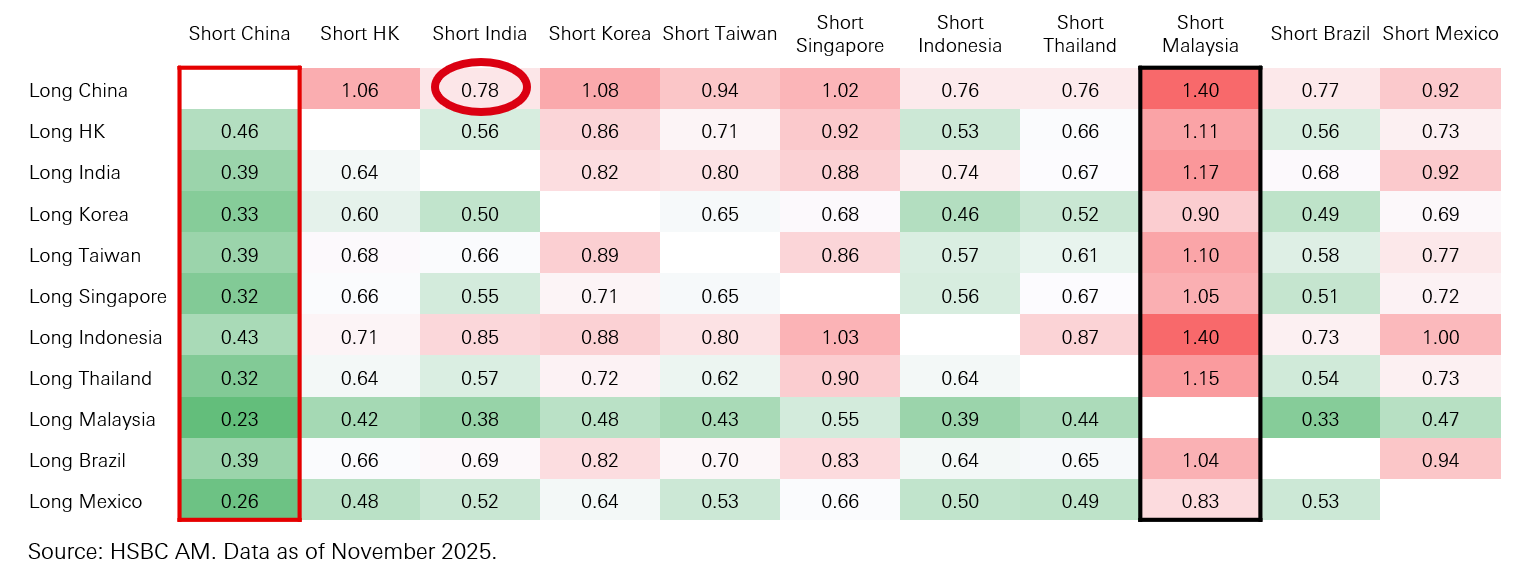
Click the image to enlarge
Source: HSBC AM. Data as of November 2025.
Several long-short equity pairs exhibit attractive hedging characteristics. Hong Kong equities may be hedged using Indian or Thai equities, while China A-shares show hedging potential against Indian and Indonesian equities. For Korea and Taiwan, China A-shares and Brazil emerge as potential hedging counterparts.
However, diversification must be distinguished from hedging. Korea and Taiwan’s high mutual correlation and shared exposure to the AI cycle mean they are unlikely to hedge each other effectively. Portfolios holding both are implicitly concentrated in a single structural theme.
Taken together, these developments imply that Asia no longer delivers diversification simply by being geographically distinct. Instead, effective diversification requires deliberately combining exposures with distinct policy regimes, economic structures and volatility transmission characteristics.
In practical terms, strategic Asian allocation should move beyond ‘Asia beta plus carry’ mindset toward a framework built on complementary structural exposures. Blending domestic-demand economies with export-cyclicals, pairing policy-anchored fixed income with higher-beta equity exposure, and using currencies selectively as stabilisers can all materially improve portfolio outcomes. For investors, Asia is no longer a single cycle. It is a multi-driver ecosystem, and the opportunity lies in harnessing its growing internal diversity to build more resilient portfolios.
For Professional Clients and intermediaries within countries and territories set out below; and for Institutional Investors and Financial Advisors in the US. This document should not be distributed to or relied upon by Retail clients/investors.
The value of investments and the income from them can go down as well as up and investors may not get back the amount originally invested. The performance figures contained in this document relate to past performance, which should not be seen as an indication of future returns. Future returns will depend, inter alia, on market conditions, investment manager’s skill, risk level and fees. Where overseas investments are held the rate of currency exchange may cause the value of such investments to go down as well as up. Investments in emerging markets are by their nature higher risk and potentially more volatile than those inherent in some established markets. Economies in emerging markets generally are heavily dependent upon international trade and, accordingly, have been and may continue to be affected adversely by trade barriers, exchange controls, managed adjustments in relative currency values and other protectionist measures imposed or negotiated by the countries and territories with which they trade. These economies also have been and may continue to be affected adversely by economic conditions in the countries and territories in which they trade.
The contents of this document may not be reproduced or further distributed to any person or entity, whether in whole or in part, for any purpose. All non-authorised reproduction or use of this document will be the responsibility of the user and may lead to legal proceedings. The material contained in this document is for general information purposes only and does not constitute advice or a recommendation to buy or sell investments. Some of the statements contained in this document may be considered forward looking statements which provide current expectations or forecasts of future events. Such forward looking statements are not guarantees of future performance or events and involve risks and uncertainties. Actual results may differ materially from those described in such forward-looking statements as a result of various factors. We do not undertake any obligation to update the forward-looking statements contained herein, or to update the reasons why actual results could differ from those projected in the forward-looking statements. This document has no contractual value and is not by any means intended as a solicitation, nor a recommendation for the purchase or sale of any financial instrument in any jurisdiction in which such an offer is not lawful. The views and opinions expressed herein are those of HSBC Asset Management at the time of preparation and are subject to change at any time. These views may not necessarily indicate current portfolios' composition. Individual portfolios managed by HSBC Asset Management primarily reflect individual clients' objectives, risk preferences, time horizon, and market liquidity. Foreign and emerging markets: investments in foreign markets involve risks such as currency rate fluctuations, potential differences in accounting and taxation policies, as well as possible political, economic, and market risks. These risks are heightened for investments in emerging markets which are also subject to greater illiquidity and volatility than developed foreign markets. This commentary is for information purposes only. It is a marketing communication and does not constitute investment advice or a recommendation to any reader of this content to buy or sell investments nor should it be regarded as investment research. It has not been prepared in accordance with legal requirements designed to promote the independence of investment research and is not subject to any prohibition on dealing ahead of its dissemination. This document is not contractually binding nor are we required to provide this to you by any legislative provision.
All data from HSBC Asset Management unless otherwise specified. Any third-party information has been obtained from sources we believe to be reliable, but which we have not independently verified.
HSBC Asset Management is the brand name for the asset management business of HSBC Group, which includes the investment activities that may be provided through our local regulated entities. HSBC Asset Management is a group of companies in many countries and territories throughout the world that are engaged in investment advisory and fund management activities, which are ultimately owned by HSBC Holdings Plc. (HSBC Group).
- In Australia, this document is issued by HSBC Bank Australia Limited ABN 48 006 434 162, AFSL 232595, for HSBC Global Asset Management (Hong Kong) Limited ARBN 132 834 149 and HSBC Global Asset Management (UK) Limited ARBN 633 929 718. This document is for institutional investors only and is not available for distribution to retail clients (as defined under the Corporations Act). HSBC Global Asset Management (Hong Kong) Limited and HSBC Global Asset Management (UK) Limited are exempt from the requirement to hold an Australian financial services license under the Corporations Act in respect of the financial services they provide. HSBC Global Asset Management (Hong Kong) Limited is regulated by the Securities and Futures Commission of Hong Kong under the Hong Kong laws, which differ from Australian laws. HSBC Global Asset Management (UK) Limited is regulated by the Financial Conduct Authority of the United Kingdom and, for the avoidance of doubt, includes the Financial Services Authority of the United Kingdom as it was previously known before 1 April 2013, under the laws of the United Kingdom, which differ from Australian laws;
- In Bermuda, this document is issued by HSBC Global Asset Management (Bermuda) Limited, of 37 Front Street, Hamilton, Bermuda which is licensed to conduct investment business by the Bermuda Monetary Authority;
- In France, Belgium, Netherlands, Luxembourg, Portugal, Greece, Finland, Norway, Denmark and Sweden this document is issued by HSBC Global Asset Management (France), a Portfolio Management Company authorised by the French regulatory authority AMF (no. GP99026);
- In Germany, this document is issued by HSBC Global Asset Management (Deutschland) GmbH which is regulated by BaFin (German clients) respective by the Austrian Financial Market Supervision FMA (Austrian clients);
- In Hong Kong, this document is issued by HSBC Global Asset Management (Hong Kong) Limited, which is regulated by the Securities and Futures Commission. This content has not been reviewed by the Securities and Futures Commission;
- In India, this document is issued by HSBC Asset Management (India) Pvt Ltd. which is regulated by the Securities and Exchange Board of India;
- In Italy and Spain, this document is issued by HSBC Global Asset Management (France), a Portfolio Management Company authorised by the French regulatory authority AMF (no. GP99026) and through the Italian and Spanish branches of HSBC Global Asset Management (France), regulated respectively by Banca d’Italia and Commissione Nazionale per le Società e la Borsa (Consob) in Italy, and the Comisión Nacional del Mercado de Valores (CNMV) in Spain;
- In Malta, this document is issued by HSBC Global Asset Management (Malta) Limited which is regulated and licensed to conduct Investment Services by the Malta Financial Services Authority under the Investment Services Act;
- In Mexico, this document is issued by HSBC Global Asset Management (Mexico), SA de CV, Sociedad Operadora de Fondos de Inversión, Grupo Financiero HSBC which is regulated by Comisión Nacional Bancaria y de Valores;
- In the United Arab Emirates, this document is issued by HSBC Investment Funds (Luxembourg) S.A. – Dubai Branch (Level 20, HSBC Tower, PO Box 66, Downtown Dubai, United Arab Emirates) regulated by the Securities and Commodities Authority (SCA) in the UAE to conduct investment fund management, portfolios management, fund administration activities (SCA Category 2 license No.20200000336) and promotion activities (SCA Category 5 license No.20200000327).
- In the United Arab Emirates, this document is issued by HSBC Global Asset Management MENA, a unit within HSBC Bank Middle East Limited, U.A.E Branch, PO Box 66 Dubai, UAE, regulated by the Central Bank of the U.A.E. and the Securities and Commodities Authority in the UAE under SCA license number 602004 for the purpose of this promotion and lead regulated by the Dubai Financial Services Authority. HSBC Bank Middle East Limited is a member of the HSBC Group and HSBC Global Asset Management MENA are marketing the relevant product only in a sub-distributing capacity on a principal-to-principal basis. HSBC Global Asset Management MENA may not be licensed under the laws of the recipient’s country of residence and therefore may not be subject to supervision of the local regulator in the recipient’s country of residence. One of more of the products and services of the manufacturer may not have been approved by or registered with the local regulator and the assets may be booked outside of the recipient’s country of residence.
- In Singapore, this document is issued by HSBC Global Asset Management (Singapore) Limited, which is regulated by the Monetary Authority of Singapore. The content in the document/video has not been reviewed by the Monetary Authority of Singapore;
- In Switzerland, this document is issued by HSBC Global Asset Management (Switzerland) AG. This document is intended for professional investor use only. For opting in and opting out according to FinSA, please refer to our website; if you wish to change your client categorization, please inform us. HSBC Global Asset Management (Switzerland) AG having its registered office at Gartenstrasse 26, PO Box, CH-8002 Zurich has a licence as an asset manager of collective investment schemes and as a representative of foreign collective investment schemes. Disputes regarding legal claims between the Client and HSBC Global Asset Management (Switzerland) AG can be settled by an ombudsman in mediation proceedings. HSBC Global Asset Management (Switzerland) AG is affiliated to the ombudsman FINOS having its registered address at Talstrasse 20, 8001 Zurich. There are general risks associated with financial instruments, please refer to the Swiss Banking Association (“SBA”) Brochure “Risks Involved in Trading in Financial Instruments”;
- In Taiwan, this document is issued by HSBC Global Asset Management (Taiwan) Limited which is regulated by the Financial Supervisory Commission R.O.C. (Taiwan);
- In Turkiye, this document is issued by HSBC Asset Management A.S. Turkiye (AMTU) which is regulated by Capital Markets Board of Turkiye. Any information here is not intended to distribute in any jurisdiction where AMTU does not have a right to. Any views here should not be perceived as investment advice, product/service offer and/or promise of income. Information given here might not be suitable for all investors and investors should be giving their own independent decisions. The investment information, comments and advice given herein are not part of investment advice activity. Investment advice services are provided by authorized institutions to persons and entities privately by considering their risk and return preferences, whereas the comments and advice included herein are of a general nature. Therefore, they may not fit your financial situation and risk and return preferences. For this reason, making an investment decision only by relying on the information given herein may not give rise to results that fit your expectations.
- In the UK, this document is issued by HSBC Global Asset Management (UK) Limited, which is authorised and regulated by the Financial Conduct Authority;
- In the US, this document is issued by HSBC Securities (USA) Inc., an HSBC broker dealer registered in the US with the Securities and Exchange Commission under the Securities Exchange Act of 1934. HSBC Securities (USA) Inc. is also a member of NYSE/FINRA/SIPC. HSBC Securities (USA) Inc. is not authorized by or registered with any other non-US regulatory authority. The contents of this document are confidential and may not be reproduced or further distributed to any person or entity, whether in whole or in part, for any purpose without prior written permission.
- In Chile, operations by HSBC's headquarters or other offices of this bank located abroad are not subject to Chilean inspections or regulations and are not covered by warranty of the Chilean state. Obtain information about the state guarantee to deposits at your bank or on www.cmfchile.cl;
- In Colombia, HSBC Bank USA NA has an authorized representative by the Superintendencia Financiera de Colombia (SFC) whereby its activities conform to the General Legal Financial System. SFC has not reviewed the information provided to the investor. This document is for the exclusive use of institutional investors in Colombia and is not for public distribution;
- In Costa Rica, the Fund and any other products or services referenced in this document are not registered with the Superintendencia General de Valores (“SUGEVAL”) and no regulator or government authority has reviewed this document, or the merits of the products and services referenced herein. This document is directed at and intended for institutional investors only.
- In Peru, HSBC Bank USA NA has an authorized representative by the Superintendencia de Banca y Seguros in Perú whereby its activities conform to the General Legal Financial System - Law No. 26702. Funds have not been registered before the Superintendencia del Mercado de Valores (SMV) and are being placed by means of a private offer. SMV has not reviewed the information provided to the investor. This document is for the exclusive use of institutional investors in Perú and is not for public distribution;
- In Uruguay, operations by HSBC's headquarters or other offices of this bank located abroad are not subject to Uruguayan inspections or regulations and are not covered by warranty of the Uruguayan state. Further information may be obtained about the state guarantee to deposits at your bank or on www.bcu.gub.uy.
Copyright © HSBC Global Asset Management Limited 2026. All rights reserved. No part of this publication may be reproduced, stored in a retrieval system, or transmitted, on any form or by any means, electronic, mechanical, photocopying, recording, or otherwise, without the prior written permission of HSBC Asset Management.
Content ID: D064084; Expiry date: 31.01.2027.


