

Why Quant, Why Now? The Demand for Quantitative Equity Strategies in Today’s Market
The overwhelmed allocator
“Should I buy the ‘Magnificent 7’?” “What about AI?” “Are active managers still worth it when so many lag the index?” “Should I go fully passive?”
Investors are asking more questions than ever...
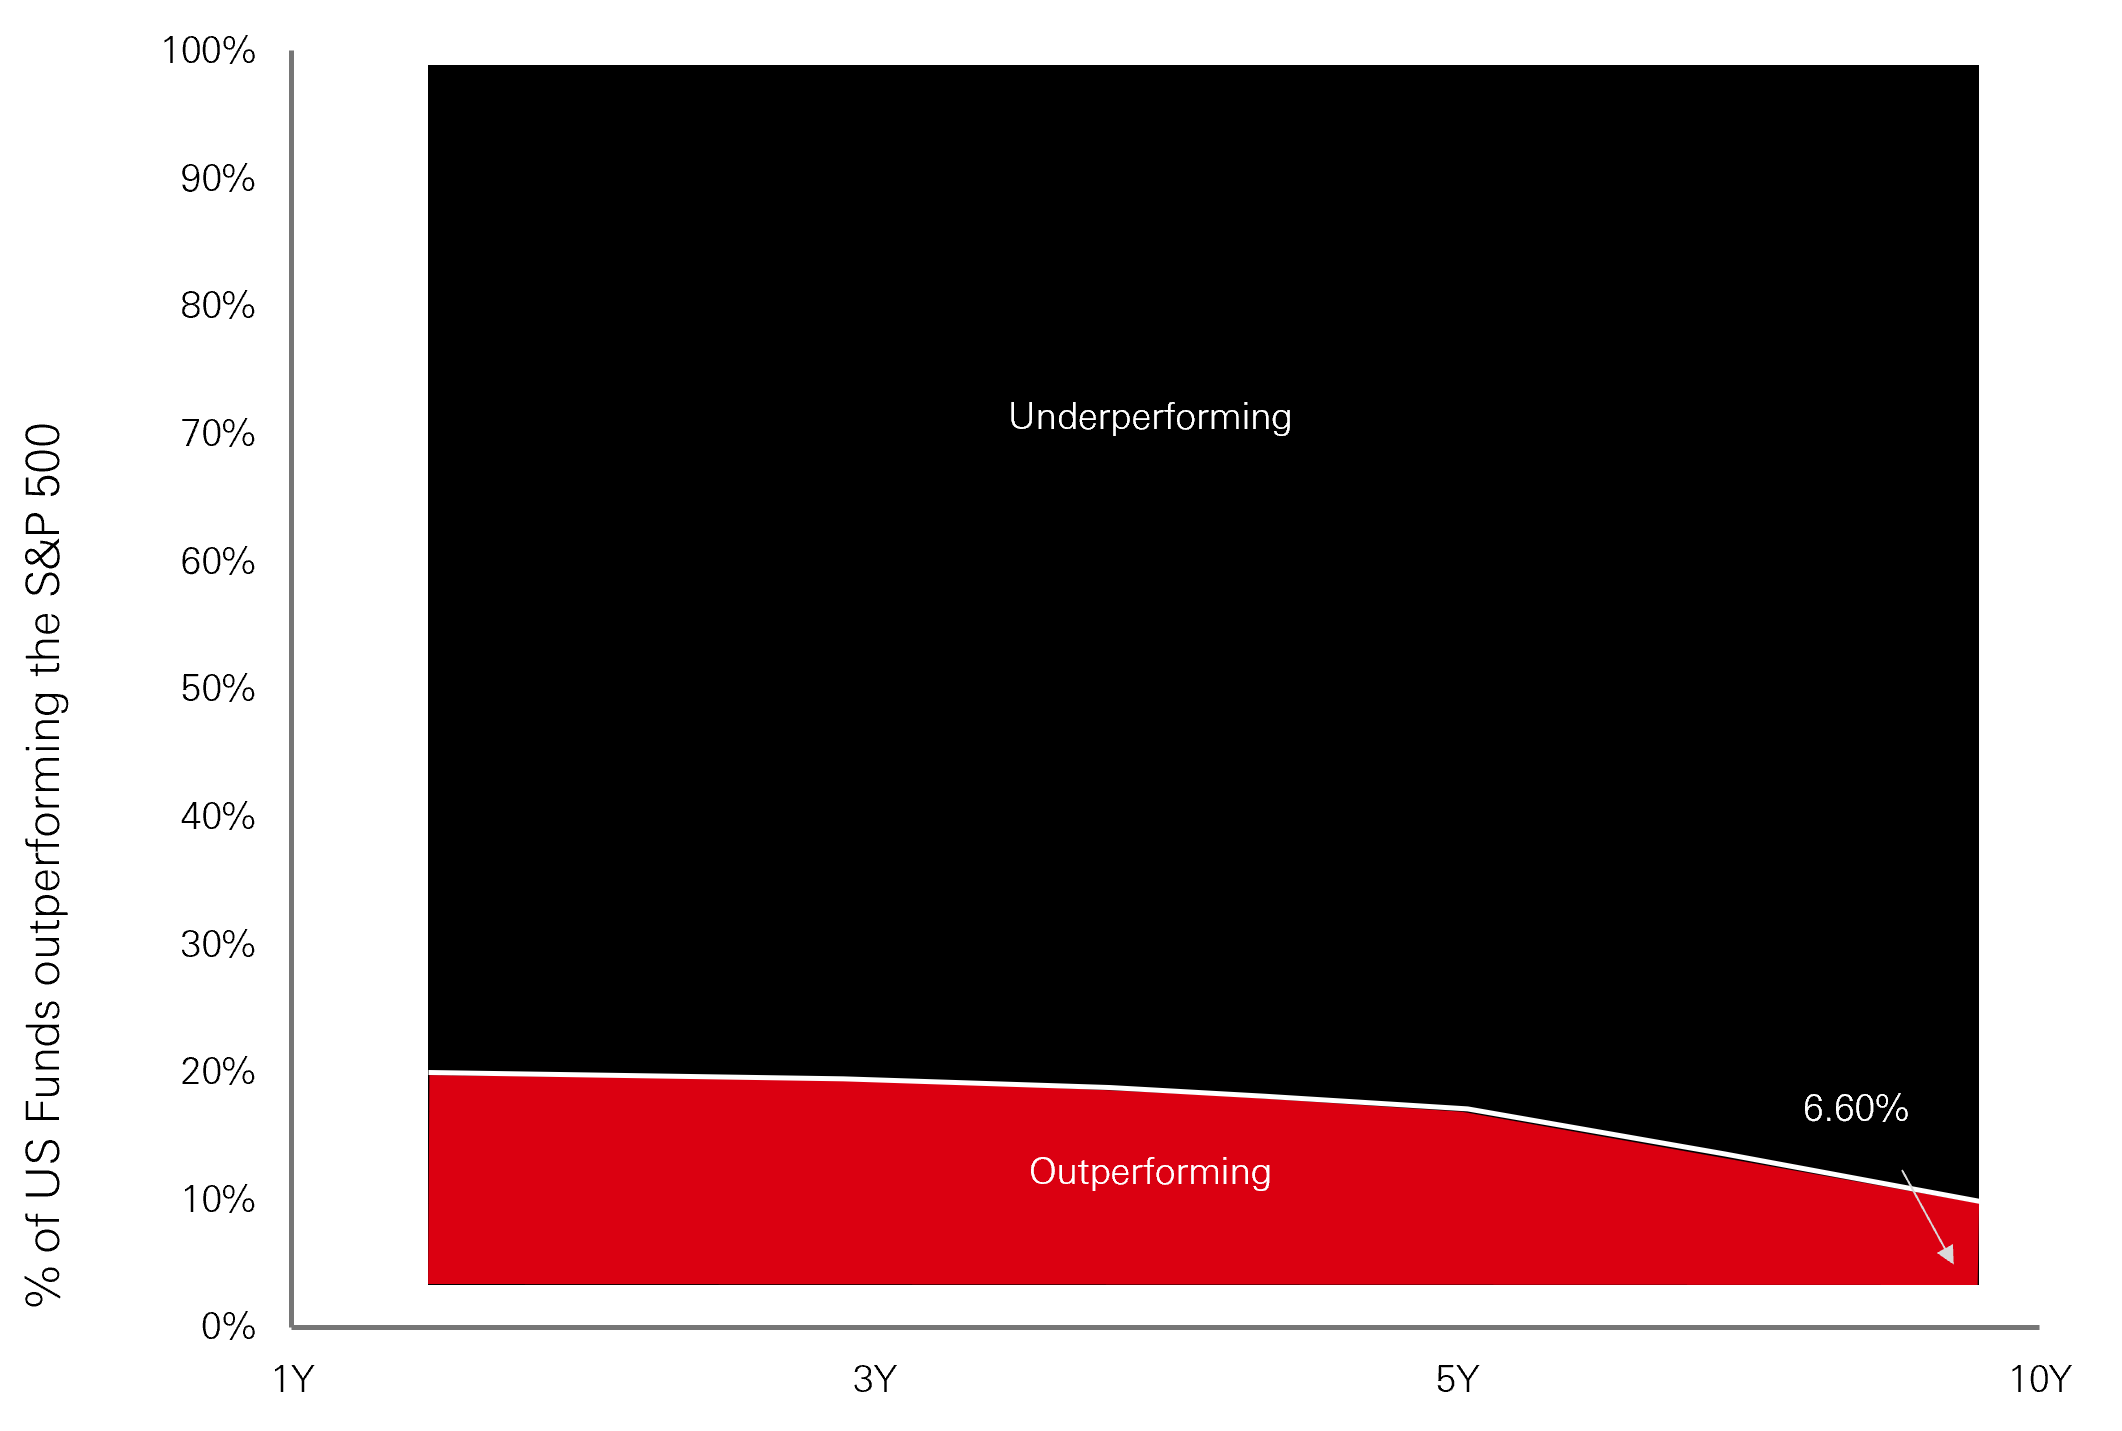
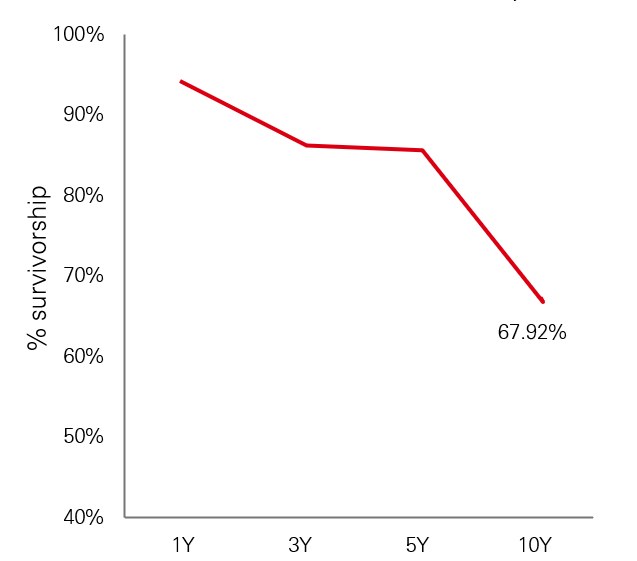
In an environment where a handful of mega‑caps have driven a large share of index returns, a pure market‑cap‑weighted allocation can look like the simplest answer – as long as that concentration persists. But history suggests leadership does change, and recent months have shown early signs of de‑concentration and a broadening of performance beyond the big tech names, creating both room and appetite for more active approaches to investing. At the same time, the data shows that most traditional stock‑picking managers struggle to keep up: only 6.6 per cent of US large‑cap core funds outperformed the S&P 500 over the last 10 years, and only 68 per cent of those funds even survived the period. This is the “investor’s dilemma”: clients want upside and resilience, but the narrative is noisy and most active funds under‑deliver. Quant, done properly, is increasingly the way many allocators are resolving that dilemma.
Outperformance is rare and persistence is rarer
Per cent of US Funds outperforming the S&P 500 Index
Click image to enlarge
Per cent of US Funds that have survived over the years
Click image to enlarge
This document provides a high level overview of the recent economic environment. It is for marketing purposes and does not constitute investment research, investment advice nor a recommendation to any reader of this content to buy or sell investments. It has not been prepared in accordance with legal requirements designed to promote the independence of investment research and is not subject to any prohibition on dealing ahead of its dissemination. Sources: S&P Dow Jones Indices LLC, CRSP. Data as of Dec 31, 2025. To correct for survivorship bias, the study uses the opportunity set available at the beginning of the period as the denominator. The count of funds that have survived and beat the index are determined. The index outperformance percentage is then reported. S&P Dow Jones Indices relies on the Lipper fund classifications, which determine a fund portfolio’s capitalisation and investment style assignments. Asset-weighted performance determined by calculating a weighted average return of all funds in that category in a particular month with each fund’s return weighted by its total net assets. Available at: https://www.spglobal.com/spdji/en/documents/spiva/spiva-us-year-end-2025.pdf
Why quant, why now? Structural drivers of renewed demand
Clear, measurable appetite for quant
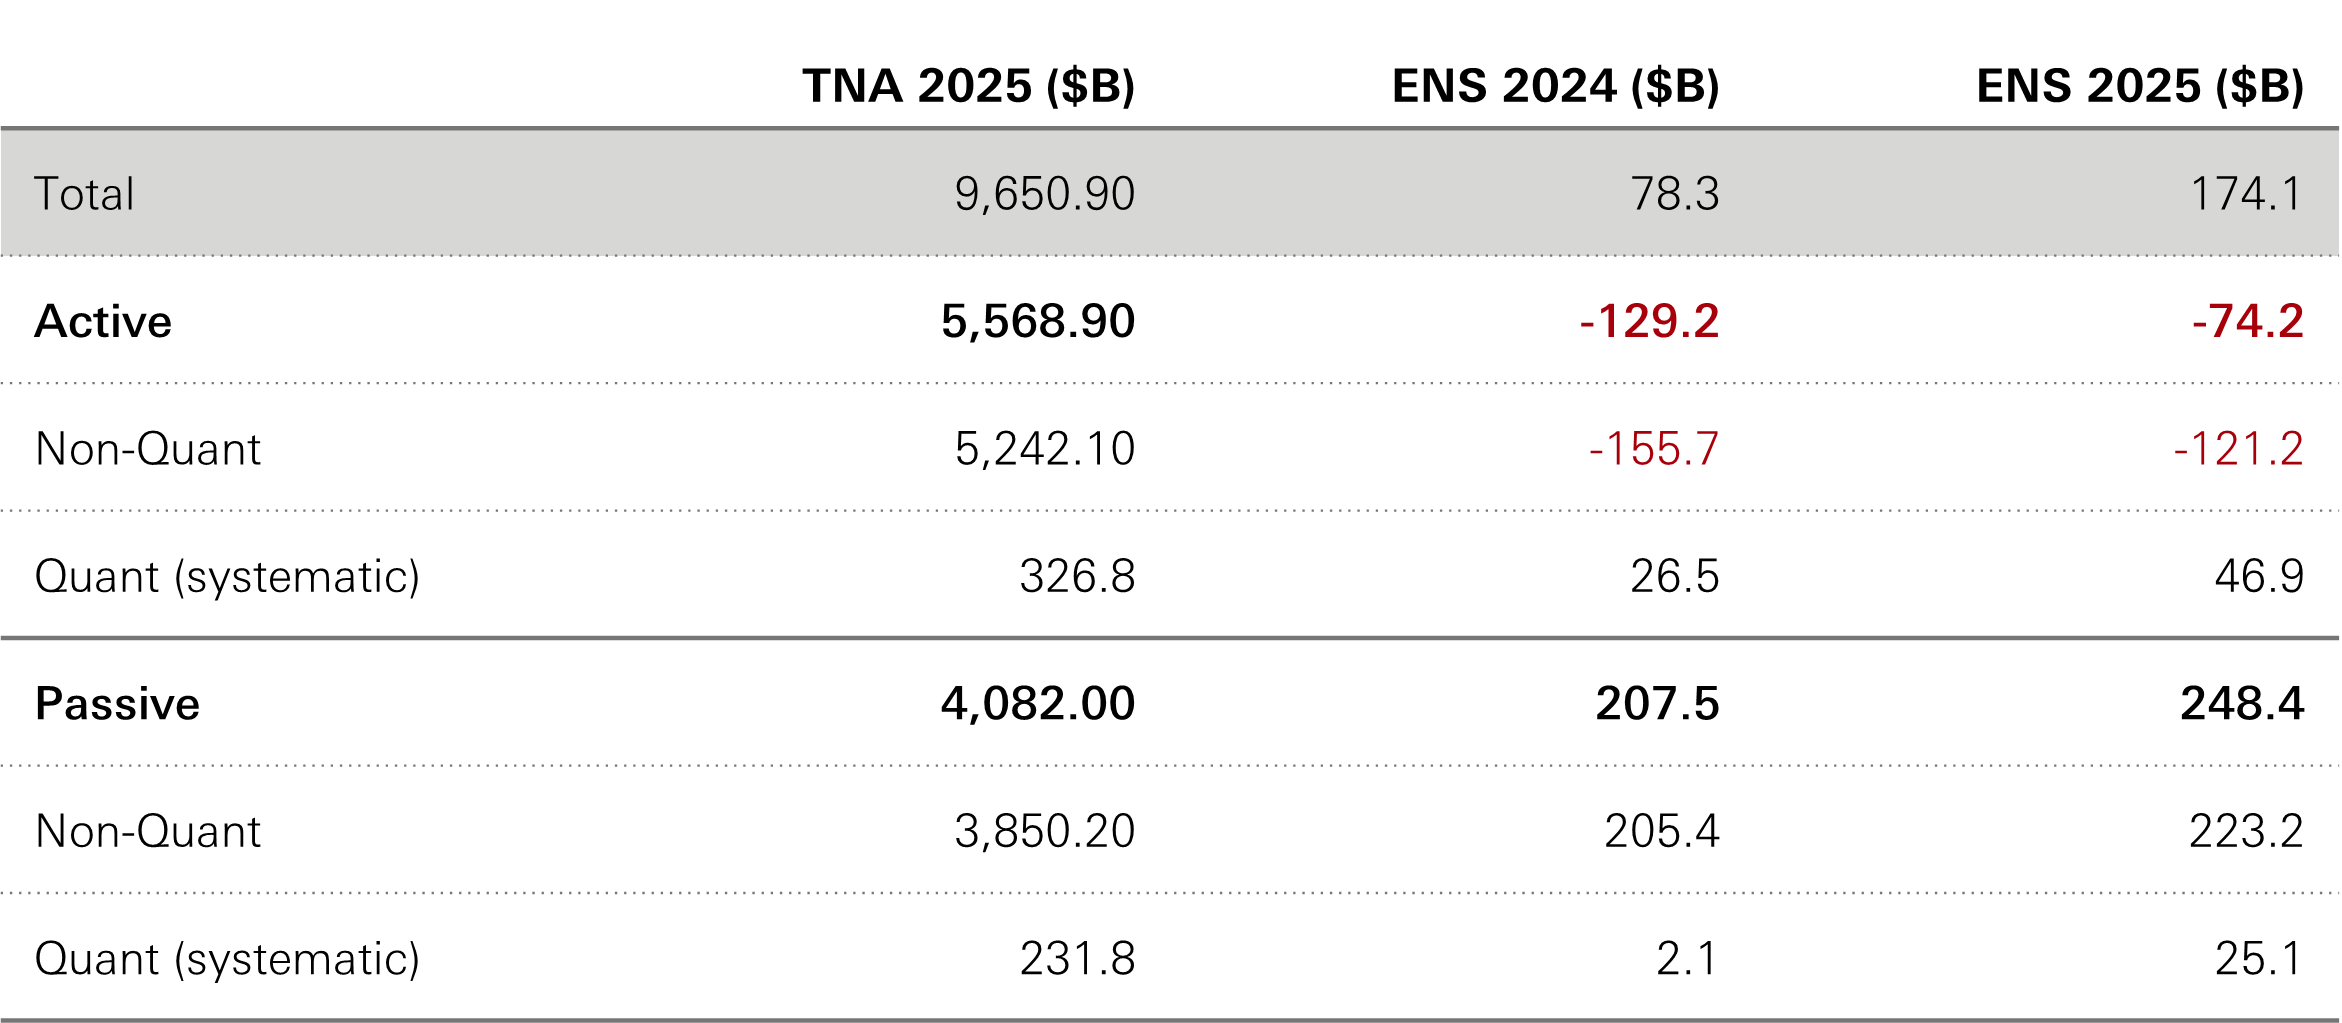
Across the industry, demand for quantitative equity strategies is now clearly visible in both investor surveys and capital flows. Large asset owners are explicitly signalling a shift toward rules‑based, data‑driven equity allocations, with recent global allocation surveys showing a meaningful share of institutions planning to increase their use of systematic strategies over the coming years. Hedge fund and alternatives outlooks tell a similar story: allocators report that quant equity is one of the areas where they are most likely to add exposure, reflecting both recent performance and a desire to diversify away from concentrated, discretionary stock‑picking risk1. This is reinforced by the rapid growth of the dedicated quant segment itself, with global quant funds already managing hundreds of billions of dollars and independent research firms projecting that this will expand to well over USD 2.5 trillion by the early 2030s2.
Quant Takes the Wheel: Active Fund Flows Shift to Systematic Strategies
Click image to enlarge
i. Extreme market concentration and the search for meaningful diversification
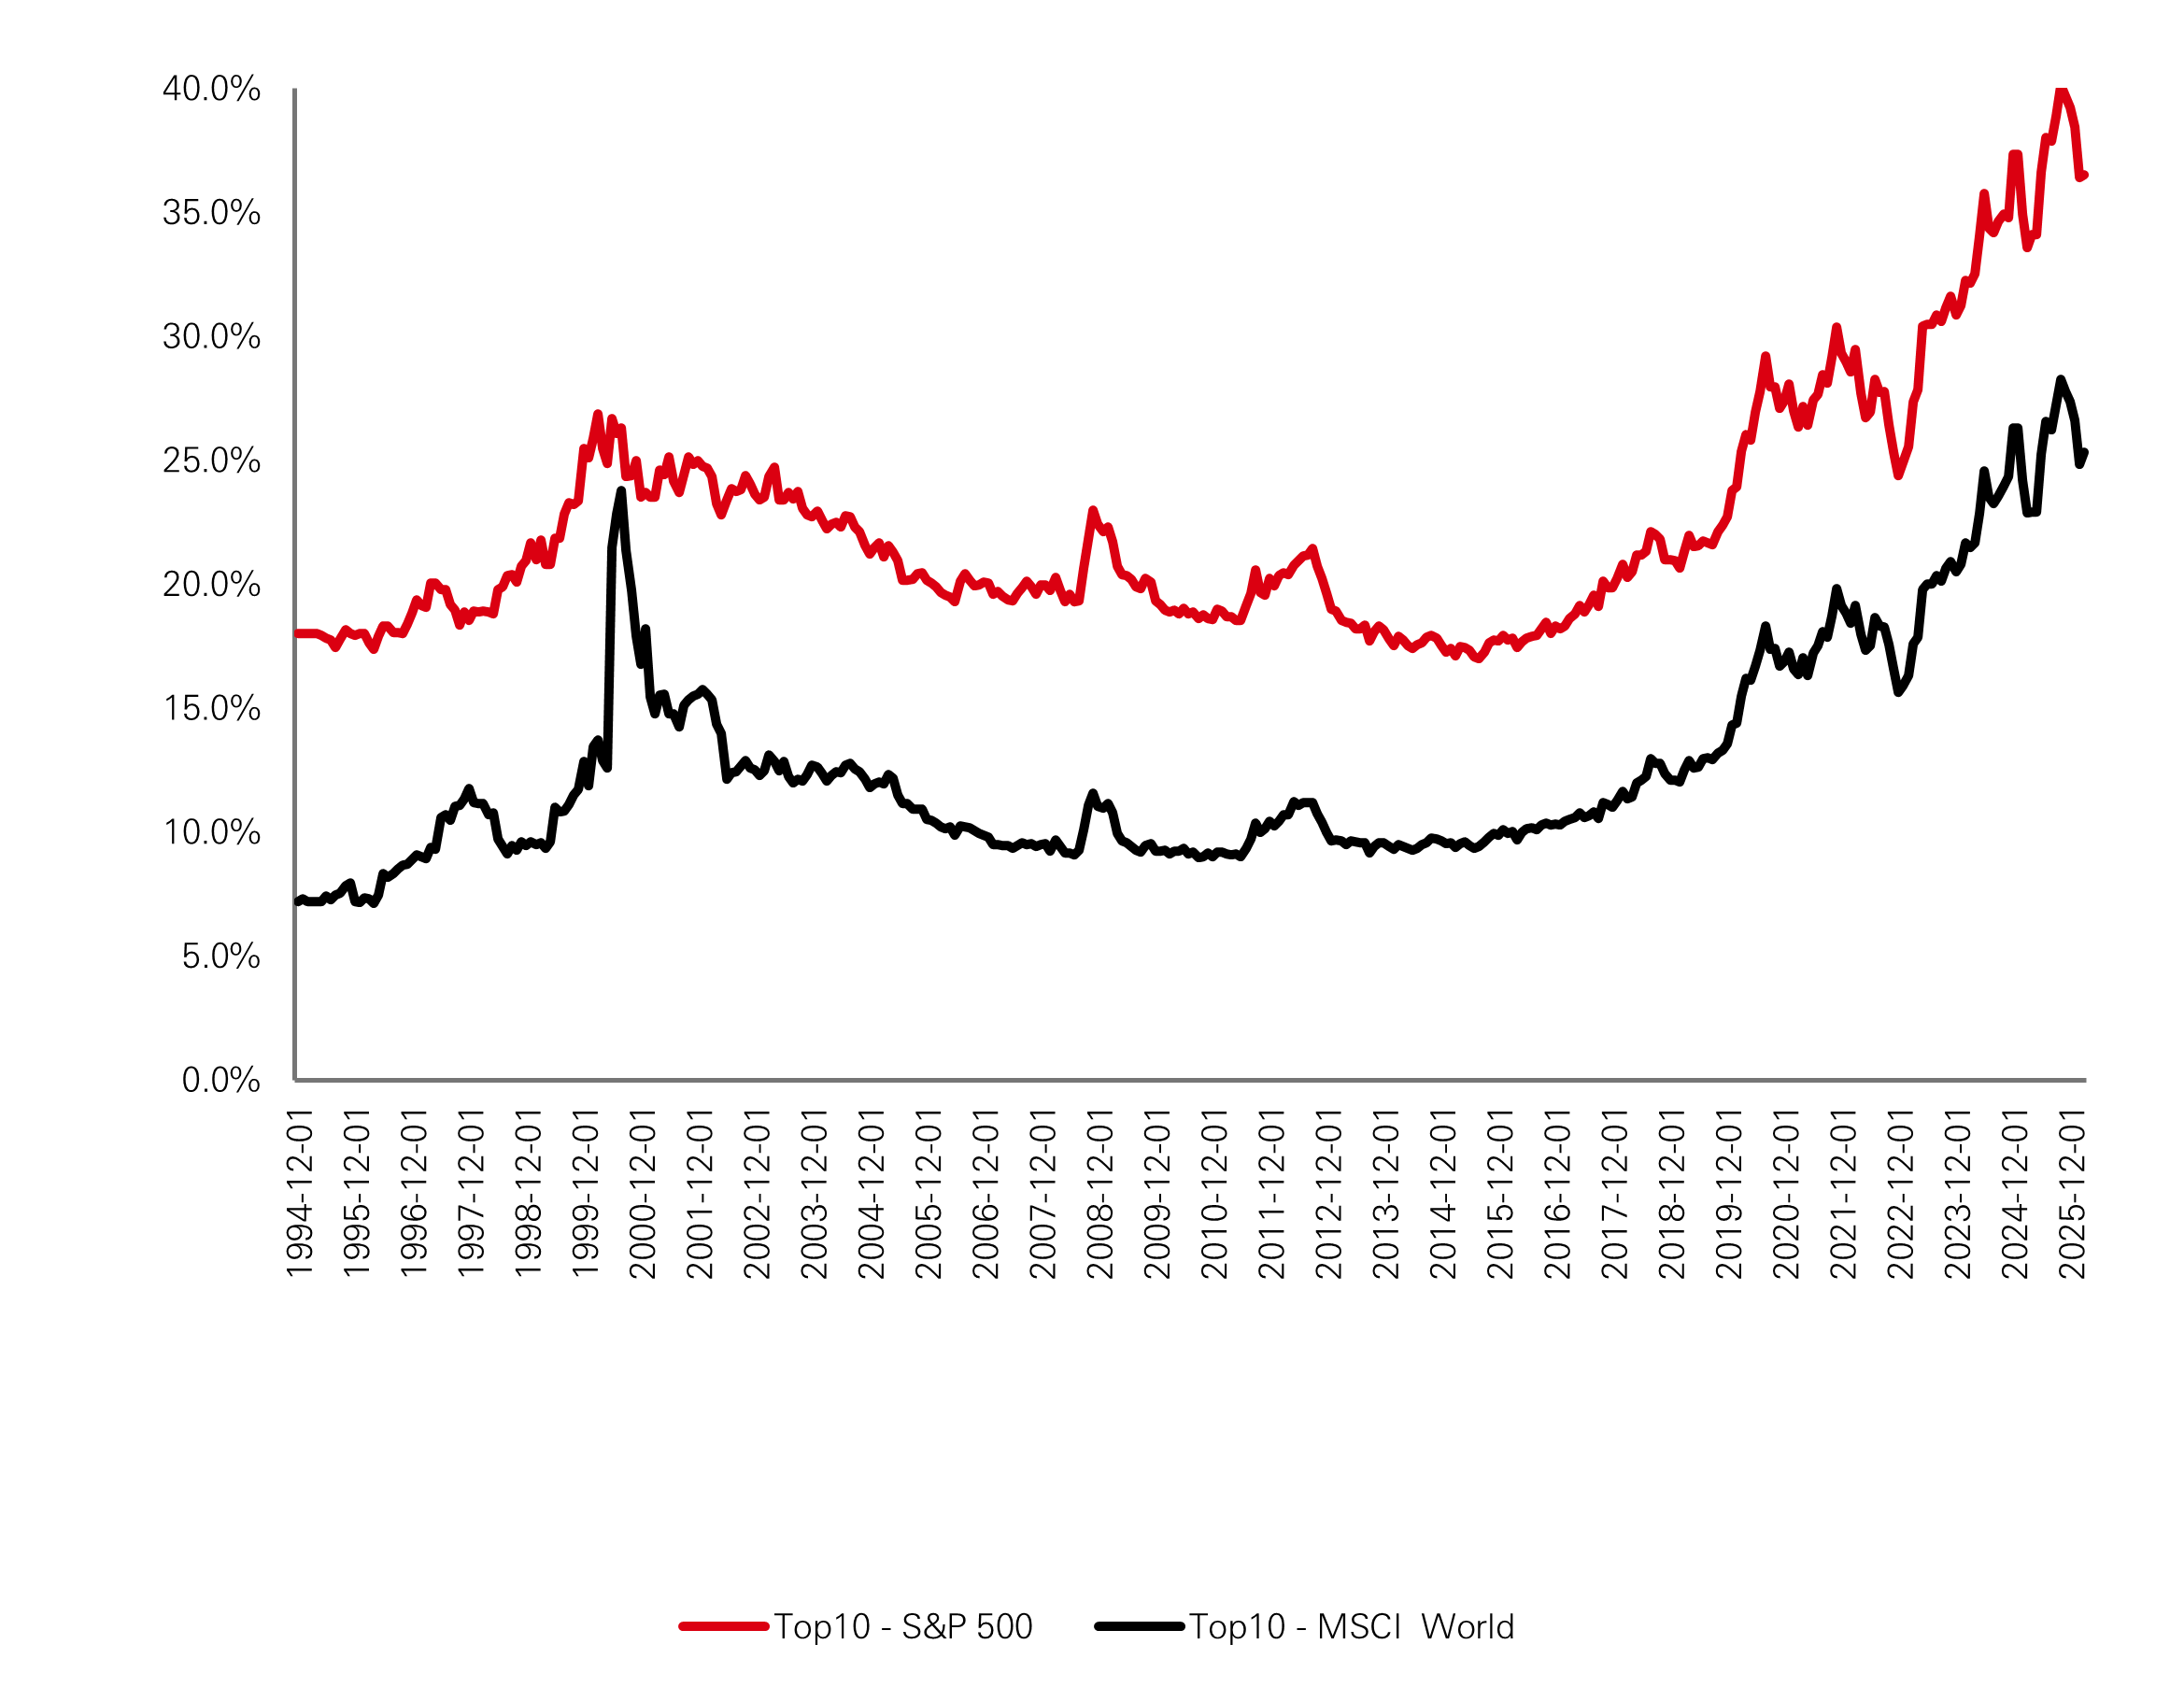
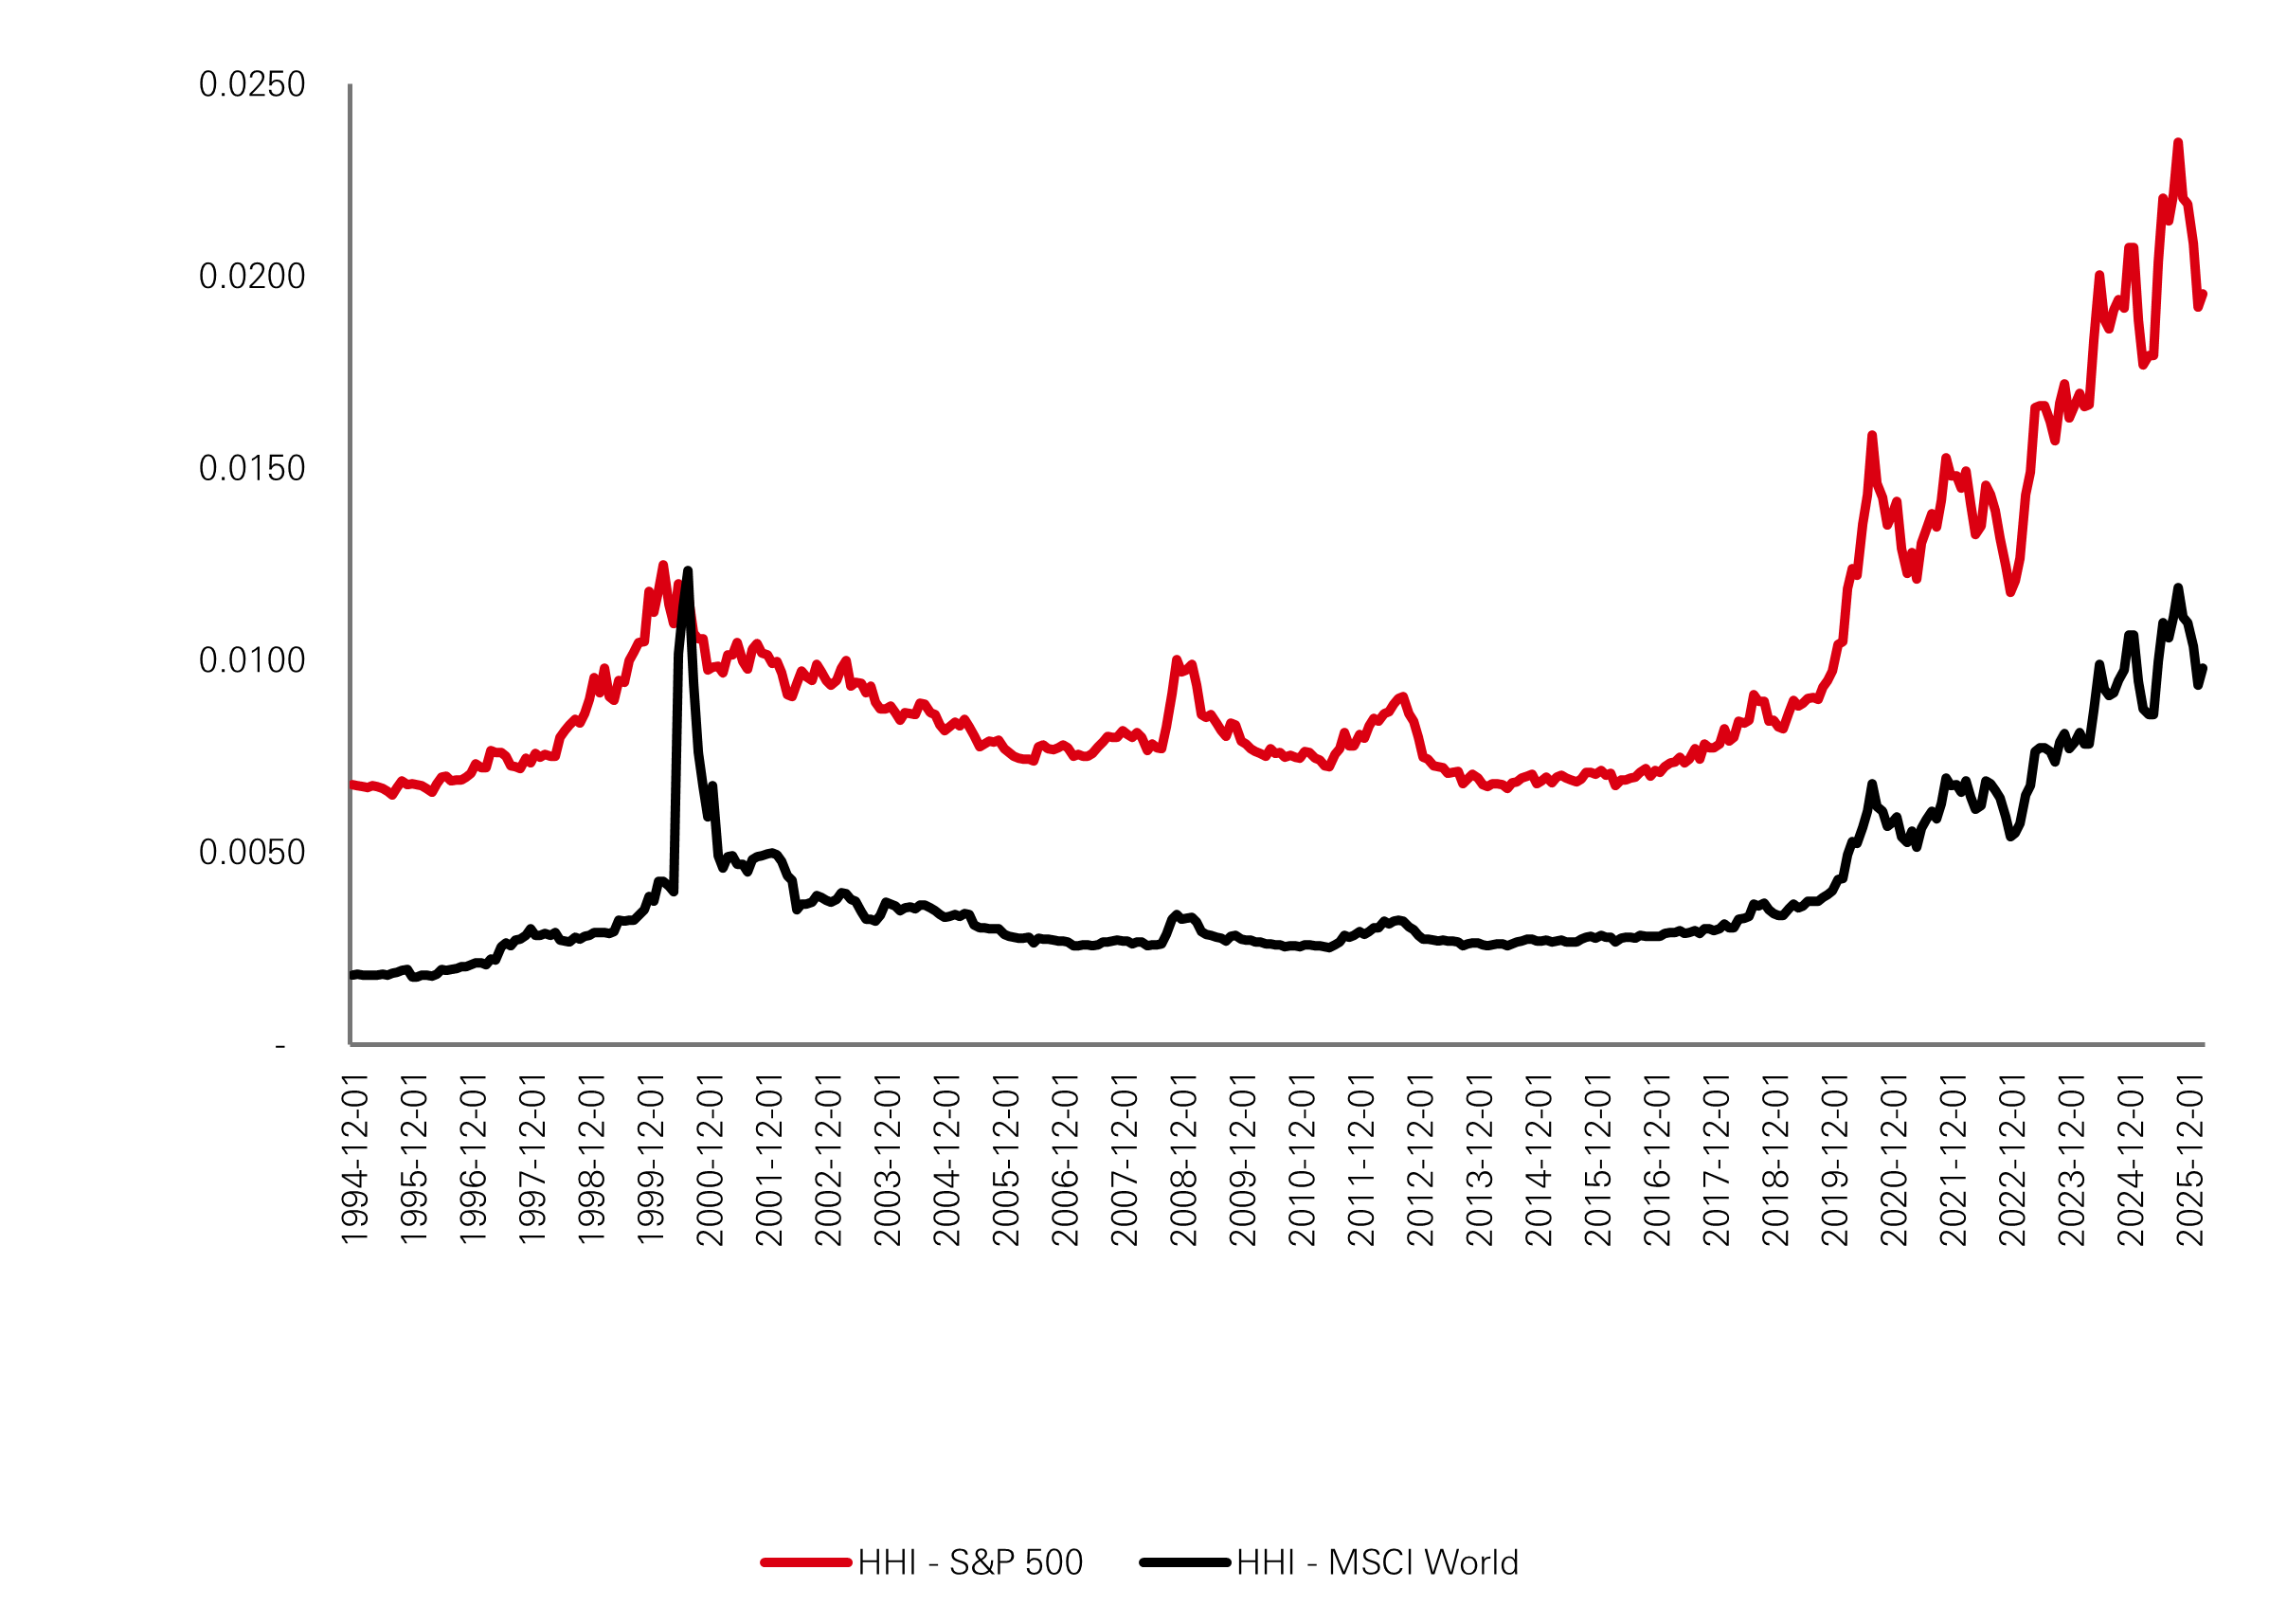
Traditional cap‑weighted indices have become heavily concentrated in a small group of mega‑cap names, especially in the US. Allocators are increasingly worried about 1) Too much risk coming from too few stocks and 2) Portfolios that look diversified on paper but are effectively large macro and style bets. This is one reason quant is becoming a “preferred anchor” for institutional portfolios, helping to “diversify the diversifiers and minimise macro biases. Recently, markets have broadened beyond mega-cap tech—cheaper valuation stocks, smaller caps and lower-volatility stocks have led more of the gains—and quant managers have been standout beneficiaries, materially outperforming as dispersion rose and the opportunity set widened beyond the mega cap tech names.
Past performance does not predict future returns. The views expressed above were held at the time of preparation and are subject to change without notice. Any forecast, projection or target where provided is indicative only and is not guaranteed in any way. HSBC Asset Management accepts no liability for any failure to meet such forecast, projection or target. Source: Broadridge, Funds domiciled in Europe and HK as of December 2025. TNA: Total net assets. ENS : Estimated Net Sales
Source 1) 2026 Hedge Fund outlook survey
Source 2) Verified Market Research 2026
Market concentration US and World
Top 10 weights
Click image to enlarge
HHI
Click image to enlarge
ii. Supporting actors – the rise of Active ETFs
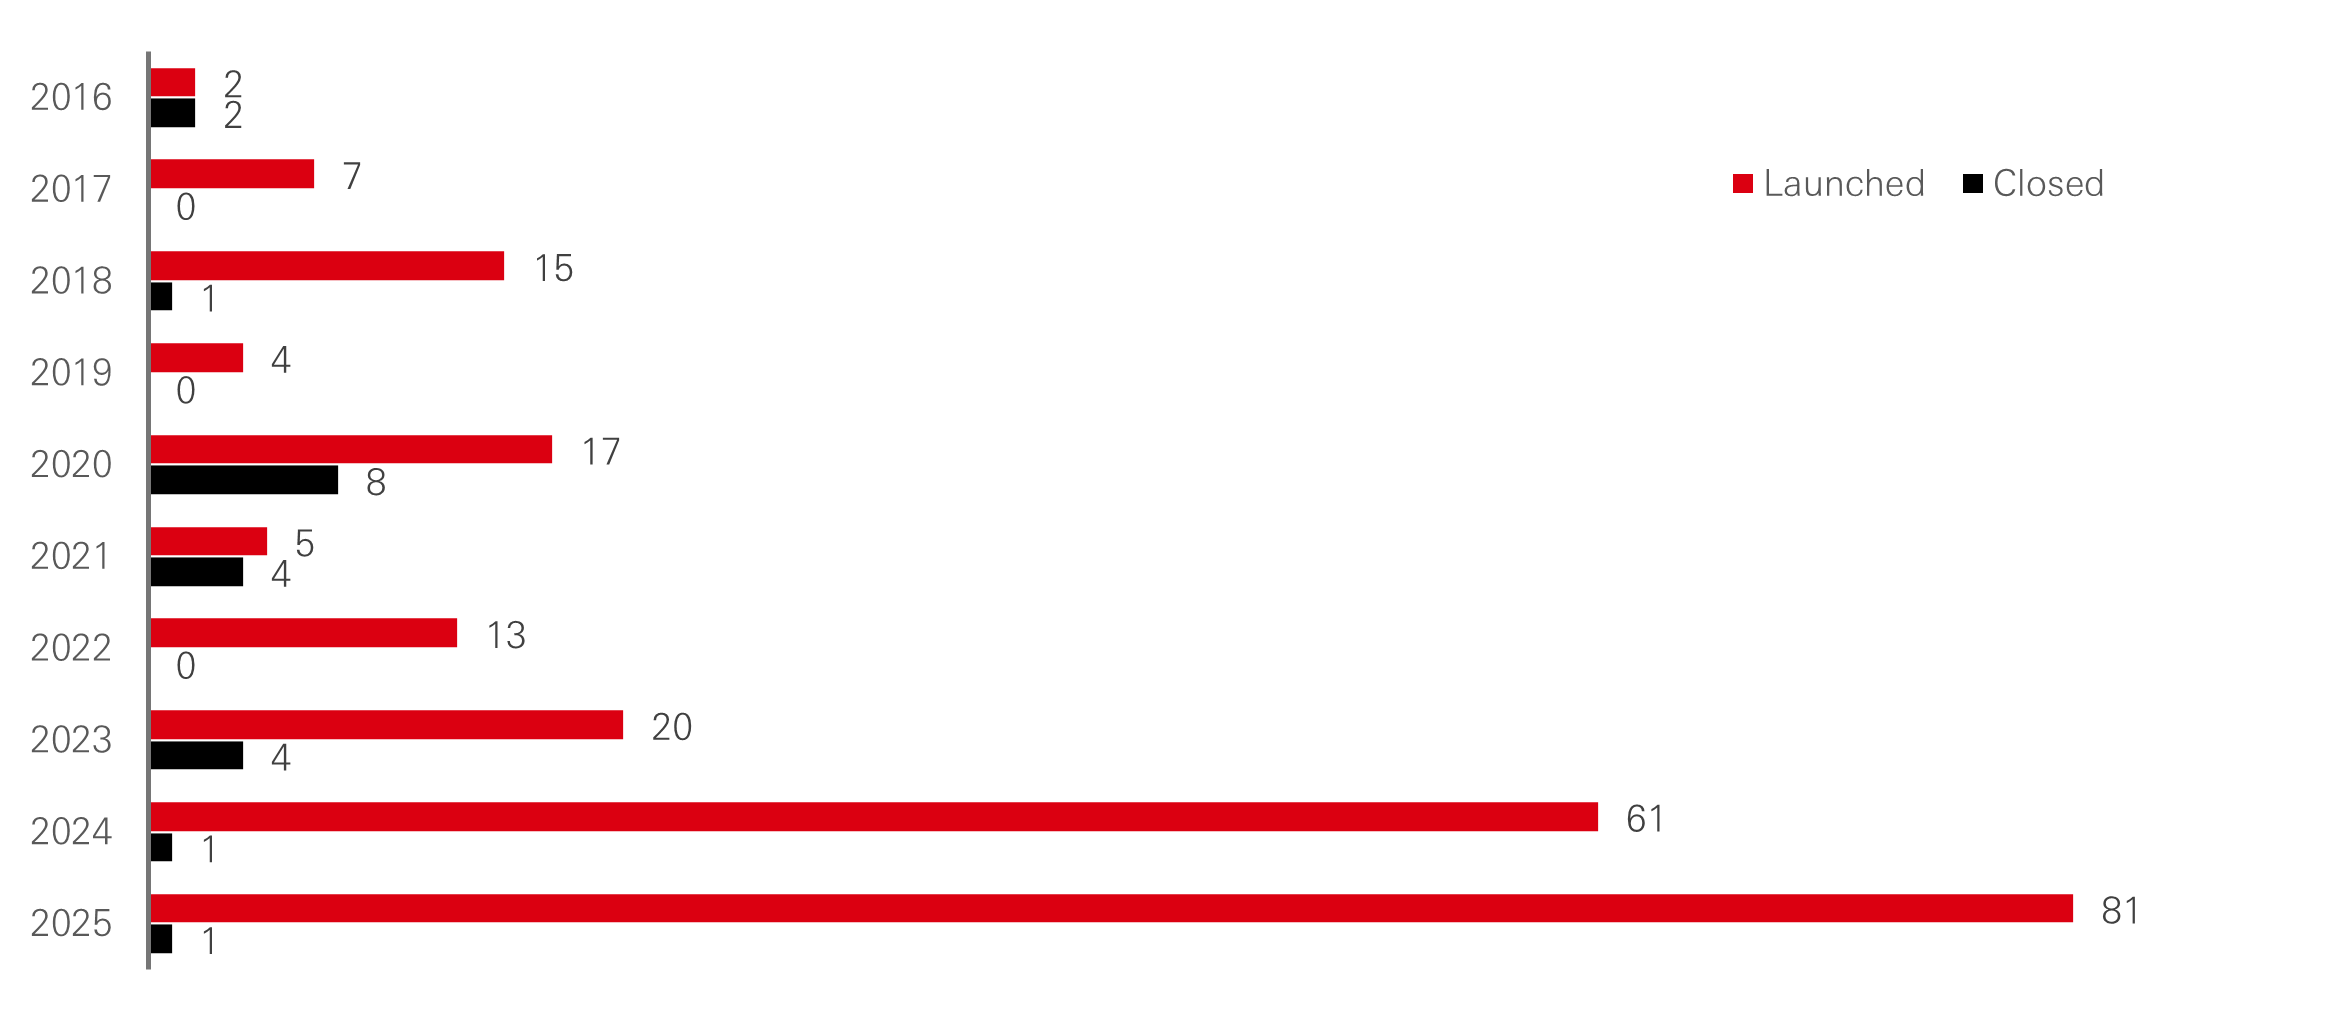
Europe’s active ETF market is moving from niche to momentum: assets have doubled in two years to €62.4 billion (Aug 2025), and while that’s still only 2.6 per cent of regional ETF assets (leaving plenty of runway versus the US), growth is being fuelled by strong inflows and an accelerating pipeline of launches with very few closures. Crucially for quant equity, Morningstar’s newer classifications show systematic “enhanced” strategies—typically rules-based, quantitatively screened and cost-competitive—gaining share as investors look for a better trade-off than pure passive: more potential alpha, daily liquidity and transparent, repeatable portfolio construction. The numbers underline the shift: in 2025, systematic (quant) active ETFs in Europe attracted €9.1 billion of inflows versus €4.8 billion for discretionary active ETFs, signalling that quant is becoming the commercial engine of active ETF adoption.
European active ETF launches and closes3
Click image to enlarge
Past performance does not predict future returns. The views expressed above were held at the time of preparation and are subject to change without notice. Any forecast, projection or target where provided is indicative only and is not guaranteed in any way. HSBC Asset Management accepts no liability for any failure to meet such forecast, projection or target. Source: Bloomberg. HHI: Herfindahl–Hirschman index, calculated as sum of squares of index weights at each dateEffective Number of Constituents: calculated as inverse of HHI index. Intuition: the portfolio behaves like an equal-weighted index of N stocks. See MSCI Index Metrics methodology, page 52 (MSCI IndexMetrics®)
Source 3) Morningstar
iii. The golden age of data and technology
We are living through what is often described as a “golden age of data and technology”, and this has profound implications for how equities are researched, and portfolios are built. IBM has estimated that around 90 per cent of the world’s data was created in just the past two years, and that this pattern keeps repeating as new sources of information come online at an accelerating pace. Every trading day, markets generate billions of data points: prices and volumes across exchanges, corporate actions, earnings announcements and revisions, macroeconomic releases, news headlines, social and traditional media sentiment, and an expanding universe of alternative and sustainability data. For a traditional fundamental manager, this deluge is simply too much to process in real time without falling back on intuition, heuristics and a limited coverage list; for a modern quantitative platform, it is the raw material from which signals, risk assessments and ultimately portfolios are systematically constructed.
Closing:
Today’s equity market is asking investors to make big calls—on concentration, AI narratives, and whether “active” still earns its fee. systematic quantitative equity is increasingly the most practical way to seek consistent, repeatable outcomes. Quant strategies are benefiting from three powerful tailwinds—extreme index concentration that heightens the need for true diversification, a measurable shift in allocator demand (including via active ETFs), and a golden age of data and technology that rewards disciplined signal-driven investing over intuition. In short, quant helps investors diversify more intelligently, reduce unintended macro/style bets, and stay invested with a transparent, rules-based process. For allocators looking to move beyond the passive-versus-discretionary debate, now is the time to consider a dedicated allocation to a robust, risk-aware quantitative equity approach—one designed to deliver scalable, repeatable performance in a market where leadership can change fast.
Important Information
The value of investments and the income from them can go down as well as up and investors may not get back the amount originally invested. Past performance contained in this document is not a reliable indicator of future performance whilst any forecasts, projections and simulations contained herein should not be relied upon as an indication of future results. Where overseas investments are held the rate of currency exchange may cause the value of such investments to go down as well as up. Investments in emerging markets are by their nature higher risk and potentially more volatile than those inherent in some established markets. Economies in Emerging Markets generally are heavily dependent upon international trade and, accordingly, have been and may continue to be affected adversely by trade barriers, exchange controls, managed adjustments in relative currency values and other protectionist measures imposed or negotiated by the countries with which they trade. These economies also have been and may continue to be affected adversely by economic conditions in the countries in which they trade. Mutual fund investments are subject to market risks, read all scheme related documents carefully.
This commentary has been produced by HSBC Asset Management to provide a high level overview of the recent economic and financial market environment, and is for information purposes only. The views expressed were held at the time of preparation; are subject to change without notice and may not reflect the views expressed in other HSBC Group communications or strategies. This marketing communication does not constitute investment advice or a recommendation to any reader of this content to buy or sell investments nor should it be regarded as investment research. The content has not been prepared in accordance with legal requirements designed to promote the independence of investment research and is not subject to any prohibition on dealing ahead of its dissemination. You should be aware that the value of any investment can go down as well as up and investors may not get back the amount originally invested. Furthermore, any investments in emerging markets are by their nature higher risk and potentially more volatile than those inherent in established markets. Any performance information shown refers to the past and should not be seen as an indication of future returns. You should always consider seeking professional advice when thinking about undertaking any form of investment.
The views expressed above were held at the time of preparation and are subject to change without notice.
There is no guarantee that these investment strategies will work under all market conditions or are suitable for all investors and each investor should evaluate their ability to invest for a long-term especially during periods of downturn in the market. No representation is being made that any account, product, or strategy will or is likely to achieve profits, losses, or results similar to those shown.
This document is prepared for general information purposes only and does not have any regard to the specific investment objectives, financial situation and the particular needs of any specific person who may receive it. Any views and opinions expressed are subject to change without notice. This document does not constitute an offering document and should not be construed as a recommendation, an offer to sell or the solicitation of an offer to purchase or subscribe to any investment. Any forecast, projection or target where provided is indicative only and is not guaranteed in any way. HSBC Global Asset Management (Hong Kong) Limited (“AMHK”) accepts no liability for any failure to meet such forecast, projection or target. AMHK has based this document on information obtained from sources it reasonably believes to be reliable. However, AMHK does not warrant, guarantee or represent, expressly or by implication, the accuracy, validity or completeness of such information. Investment involves risk. Past performance is not indicative of future performance. Please refer to the offering document for further details including the risk factors. This document has not been reviewed by the Securities and Futures Commission. Copyright © HSBC Global Asset Management (Hong Kong) Limited 2026. All rights reserved. This document is issued by HSBC Global Asset Management (Hong Kong) Limited.
Content ID: D076536_V1.0 ; Expiry date: 30.04.2027.